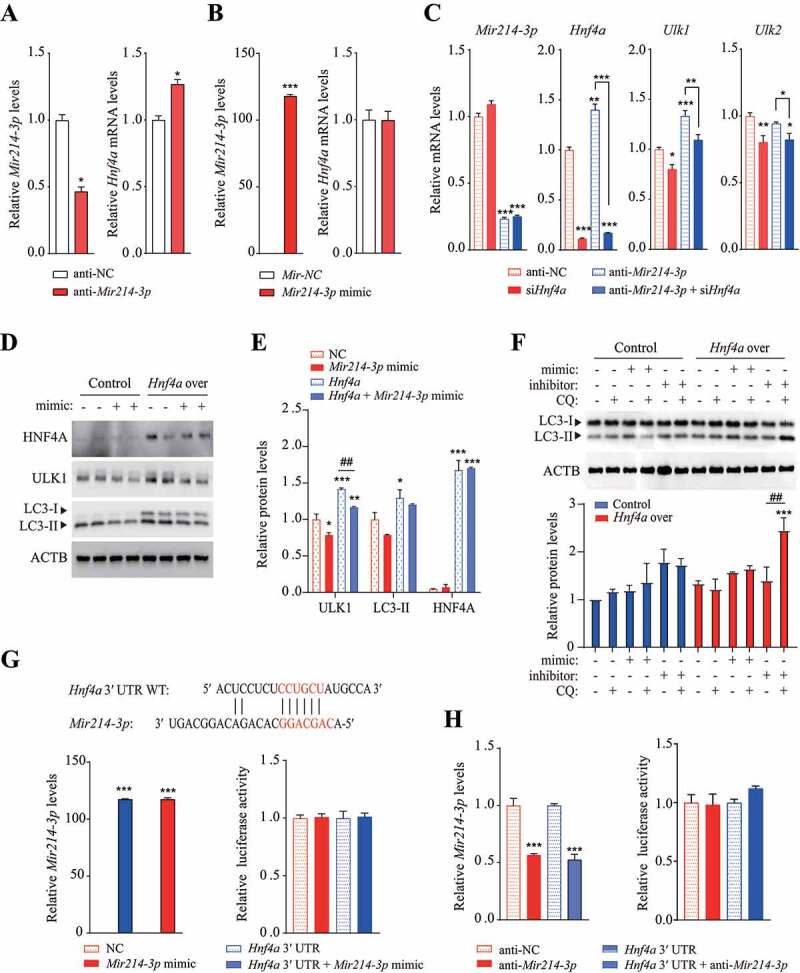
Figure 4.

Mir214-3p and Hnf4a independently regulated Ulk1 expression. (A–B) Hepatocytes were transfected with (A) Mir214-3p inhibitor or (B) mimic for 48 h; Hnf4a expression was measured using qRT-PCR. Values represent mean ± SD (n = 3). * p < 0.05; *** p < 0.001, compared to the negative control (NC). (C) Hepatocytes were co-transfected with anti-Mir214-3p and Hnf4a siRNA for 48 h. After incubation, relative expression of Ulk1 and Ulk2 was measured using qPCR. (D) Mir214-3p mimic was transfected into Hnf4a-overexpressing hepatocytes for 48 h. After incubation, relative protein levels were measured using immunoblotting. (E) Protein levels (expressed as the density ratio of protein:ACTB) were quantified using ImageJ. (F) Autophagy flux assay performed using the lysosomal inhibitor chloroquine (CQ). Mir214-3p mimic or inhibitor was transfected into Hnf4a-overexpressing hepatocytes for 48 h. Cells were treated with or without 10 µM CQ for 4 h. (G–H) Dual reporter assay was performed using GLuc-SEAP vector containing the 3′ UTR of Hnf4a mRNA. Hepatocytes were co-transfected with Glu-SEAP vector and (G) Mir214-3p mimic or (H) anti-Mir214-3p for 48 h. Luciferase activity in the medium was measured, and Mir214-3p levels were quantified in cell lysates. Values represent mean ± SD (n = 3). *** p < 0.001, compared to the negative control. GLuc: Gaussia luciferase; mRNA: messenger RNA; NC: negative control; qPCR: quantitative polymerase chain reaction; SD: standard deviation; siRNA: small interfering RNA; SEAP: secreted alkaline phosphatase; UTR: untranslated region
