
Figure 6.
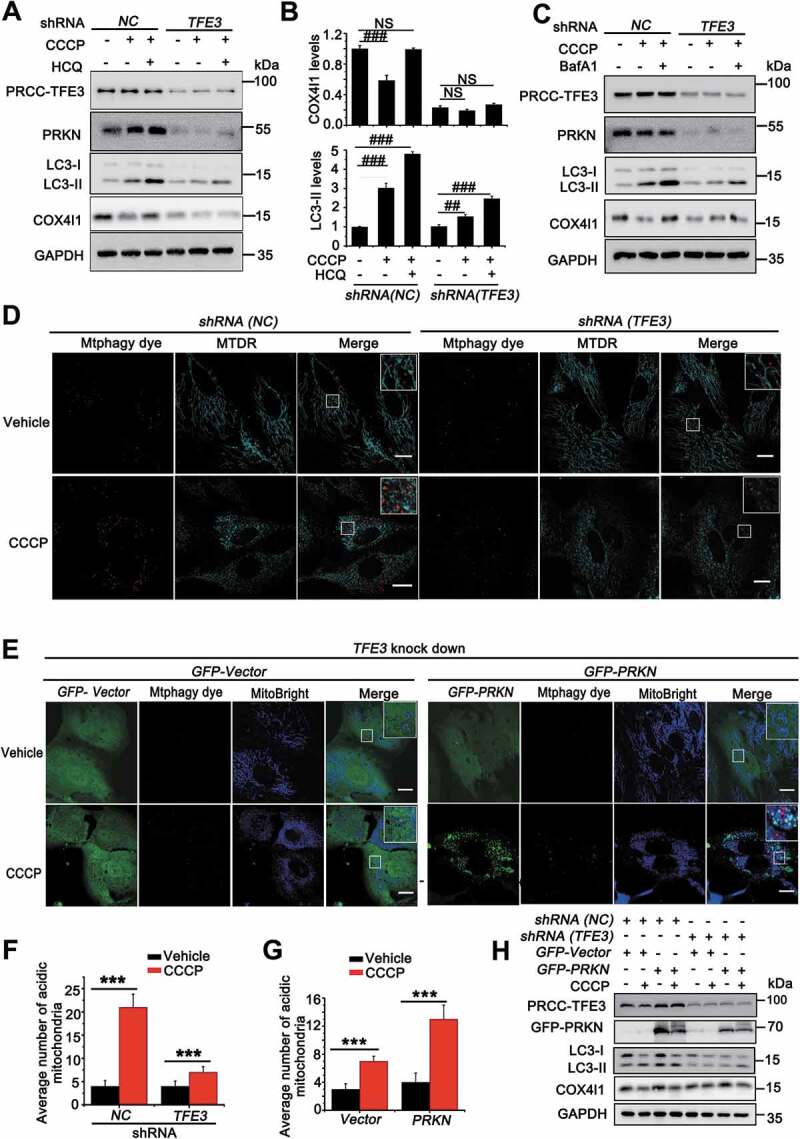
PRCC-TFE3 fusions-PRKN axis drives mitophagy in UOK120 cells. (A) UOK120 cells were infected with Lenti.shRNA (NC) or Lenti.shRNA (TFE3), and then PRCC-TFE3, PRKN, LC3-II and COX4I1 were examined by western blot after treatment with CCCP (10 μM) for 6 h in the presence or absence of HCQ (30 μM). (B) Densitometric analysis of COX4I1:GAPDH(upper) and LC3-II:GAPDH (down). Data are presented as mean ± s.e.m from 3 independent experiments. #p < 0.05, ##p < 0.01, ###p < 0.001 (One-way ANOVA with Dunnett posttests). (C) UOK120 cells were infected with Lenti.shRNA (NC) or Lenti.shRNA (TFE3), and then PRCC-TFE3, PRKN, LC3-II and COX4I1 were examined by western blot after treatment with CCCP (10 μM) for 6 h in the presence or absence of Baf A1 (200 nM). (D) UOK120 cells were infected with Lenti.shRNA (NC) or Lenti.shRNA (TFE3) followed by staining with the Mtphagy dye and MitoTracker Deep Red, and then visualization of Mtphagy dye and MitoTracker Deep Red using live-cell imaging microscopy after treatment with CCCP (10 μM) for 12 h. (E) UOK120 cells were co-infected with Lenti.shRNA (TFE3) and Lenti.GFP-Vector or Lenti.GFP-PRKN followed by staining with the Mtphagy dye and MitoBright, and then visualization of Mtphagy dye, GFP and MitoBright using live-cell imaging microscopy after treatment with CCCP (10 μM) for 12 h. (F and G) quantification of acidic (red-only) mitochondria in different group of (D and E). Data are presented as mean ± s.e.m from 3 independent experiments (10 cells/group/experiment in F and G). *p < 0.05, **p < 0.01, ***p < 0.001 (two-tailed t-test). (H) UOK120 cells were co-infected with Lenti.shRNA (TFE3) and Lenti.GFP-Vector or Lenti.GFP-PRKN, and then PRCC-TFE3, PRKN, LC3-II and COX4I1 were examined by western blot after treatment with CCCP (10 μM) for 6 h. GAPDH was used as a loading control. NS, no significance. Scale bars: 20 μm