
Figure 4.
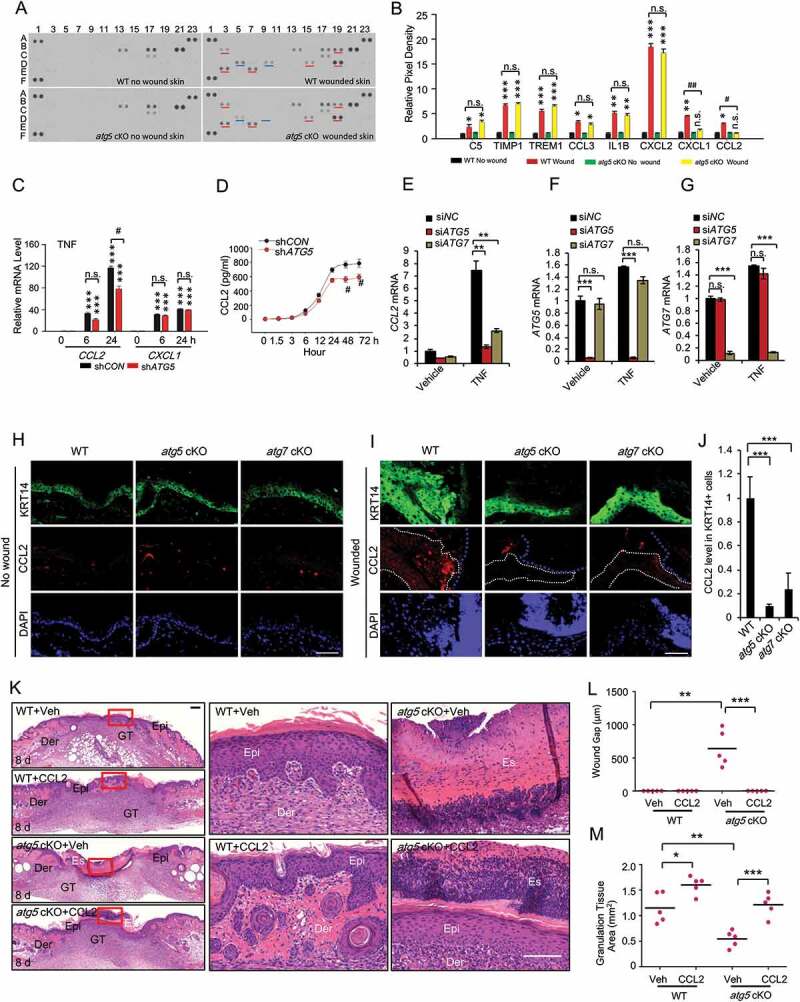
Epidermal autophagy deficiency inhibits wound healing through inhibiting CCL2. (A) Mouse cytokine array of normal and wounded skin (wound and adjacent area) sections on day 3 in WT and atg5 cKO mice. Dots with alterations were indicated by blue and red line. (B) The relative mean pixel density (fold of WT Non-Wound) of cytokines was listed with a mouse cytokine array assay (n = 6). (C) Real-time PCR for CCL2 and CXCL1 mRNA level in HaCaT cells stably transfected with shCON or shATG5 at 0, 6 and 24 h following TNF treatment. (D) CCL2 production in conditioned medium from HaCaT cells infected with shCON and shATG5 over a time course following TNF treatment. (E, F, and G) Real-time PCR analysis for CCL2 in NHEK cells transfected with siNC, siATG5, and siATG7, treated with or without TNF (100 ng/ml) for 8 h. Data are shown as mean ± S.E. (n ≥ 3). (H and I) Immunofluorescence staining of KRT14 and CCL2 in intact (H) and wound skin (I) on day 2 in WT, atg5 cKO, and atg7 cKO mice. Scale bar: 50 μm. (J) Quantification of the levels of CCL2 in wound healing on day 2 (I) was analyzed by ImageJ (N = 15). The right side of blue dot line is the wound area, and the inside of white dot indicates the area of keratinocyte expressing KRT14. (K) Wound healing as monitored by histological staining at day 8 after injury in WT, atg5 cKO mice with or without CCL2 topical treatment. Epi: epidermis; Der: dermis; Es: eschar. Scale bars: 200 (left panel) and 100 (right penal) µm. (L and M) Quantification of wound gap (L) granulation tissue (M) in K (n = 6). *, P < 0.05; **, P < 0.01; ***, P < 0.001; between comparison groups. #, P < 0.05; ##, P < 0.01 for B and C; compared with their corresponding non-wounded control groups. n.s., not statistically significant. Student’s t-test. Results were obtained from at least three independent experiments (C-G)