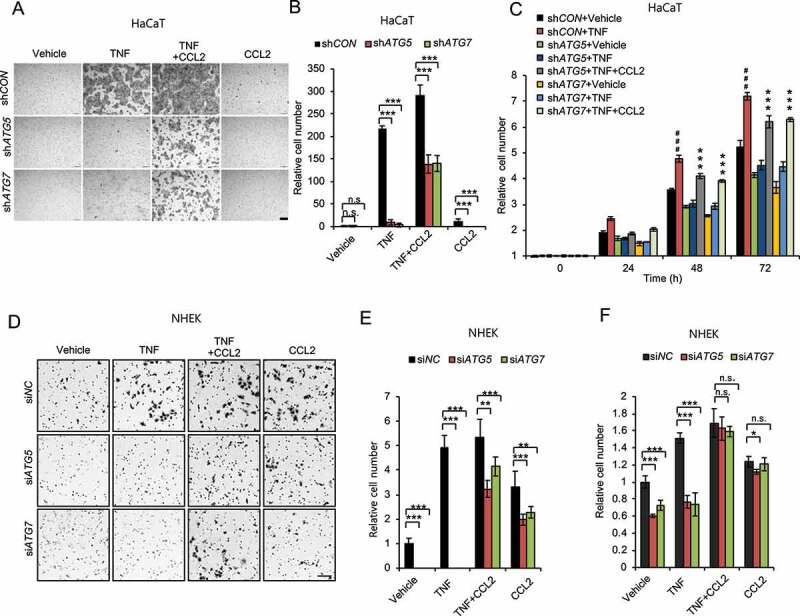
Figure 5.

Autophagy promotes keratinocyte migration and proliferation through CCL2. (A) Representative images of cell migration assay with HaCaT cells with or without knockdown of either ATG5 or ATG7 treated with or without TNF (100 ng/ml) and/or CCL2 (100 ng/ml) for 24 h. Scale bars: 200 µm. (B) Quantification of A (n = 8). (C) Cell proliferation assay in cells as in A (n = 3). ***, P < 0.001; compared with its corresponding group without CCL2 treatment. ###, P < 0.001; compared with the shCON+Vehicle group. (D) Representative images of cell migration assay with NHEK cells, transfected with siNC, siATG5 and siATG7, treated with or without TNF (100 ng/ml) and/or CCL2 (100 ng/ml) for 1 d. Scale bars: 100 µm. (E) Quantification of D (n = 8). (F) Cell proliferation assay in NHEK cells transfected with siNC, siATG5 and siATG7, then treated with or without TNF (100 ng/ml) and/or CCL2 (100 ng/ml) for 2 d (n = 3). All bars represent mean ± SD; *, P < 0.05; **, P < 0.01; ***, P < 0.001; Student’s t-test. Results were obtained from at least three independent experiments (A-F)
