Figure 5.

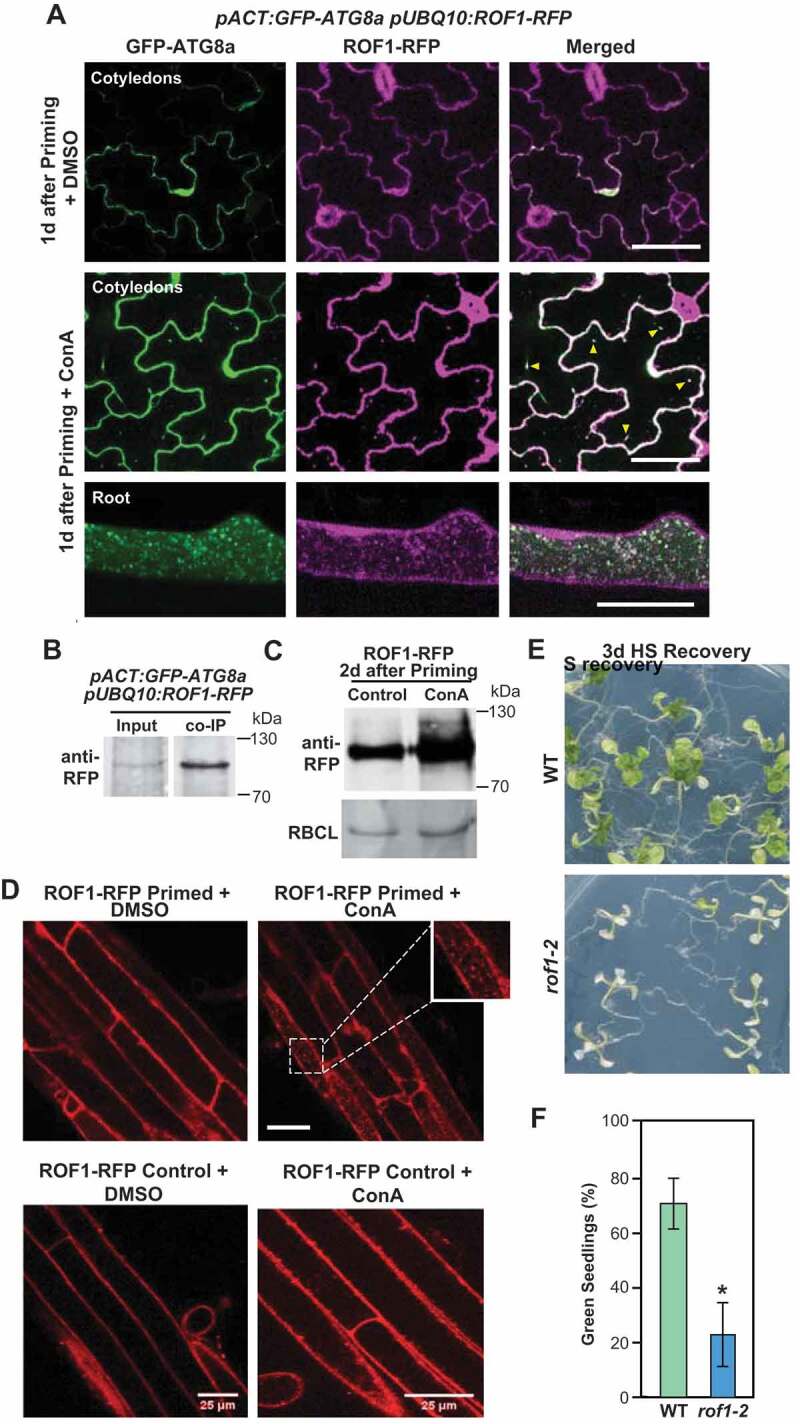
Autophagy is involved in the degradation of ROF1 during HS memory. (A) GFP-ATG8a and ROF1-RFP colocalized after HS priming (1 d) in pACT:GFP-ATG8a/pUBQ10:ROF1-RFP transgenic plants (cotyledons, upper panel; roots, lower panel). Representative microscopy images are shown. Scale bars: 50 µm. (B) ROF1 co-immunoprecipitates with ATG8. pACT:GFP-ATG8a/pUBQ10:ROF1-RFP seedlings were subjected to priming HS and samples were harvested 2 d into the HS recovery phase. Total proteins were extracted and immunoprecipitated with anti-GFP antibody beads. Immunoprecipitates (IP) and total protein extracts were immunoblotted with an anti-RFP antibody (Chromotek, 6G6). (C) Higher accumulation of ROF1-RFP during the HS recovery phase (2 d after priming) upon treatment with ConA compared with a DMSO control. ROF1-RFP was detected in the seedlings of pUBQ10:ROF1-RFP/Col-0 by immunoblotting using an anti-RFP antibody (Chromotek, 6G6; 1:1,000). RBCL detected by Ponceau-staining was used as the loading control (bottom panel). Relative intensities (RFP:loading control) are shown as numerical values. Full-size images are presented in Figure S7. (D) Presence of ROF1-RFP in the central vacuole during the HS recovery phase. Accumulation of ROF1-RFP in pUBQ10:ROF1-RFP seedlings 2 d after priming HS treatment or control (unprimed) was assessed in roots (differentiation zone) by fluorescence confocal microscopy following DMSO control and ConA treatment. Scale bars: 25 µm. (E) HS memory phenotypes of rof1-2 and Col-0 wild type (WT) seedlings. Briefly, 5-d-old rof1-2 and Col-0 WT seedlings were subjected to HS regimes to explore HS memory as shown in Figure 1A. Phenotypes were determined 12 d after triggering HS. Representative images are shown. (F) Percentages of green seedlings (indicating seedling survival rates) are shown in bar graphs in the right panel. Data are means ± SD (n = 4 sets of 25 seedlings). Asterisks indicate significant (p ≤ 0.05) differences between Col-0 and rof1-2 plants according to Student’s t-test
