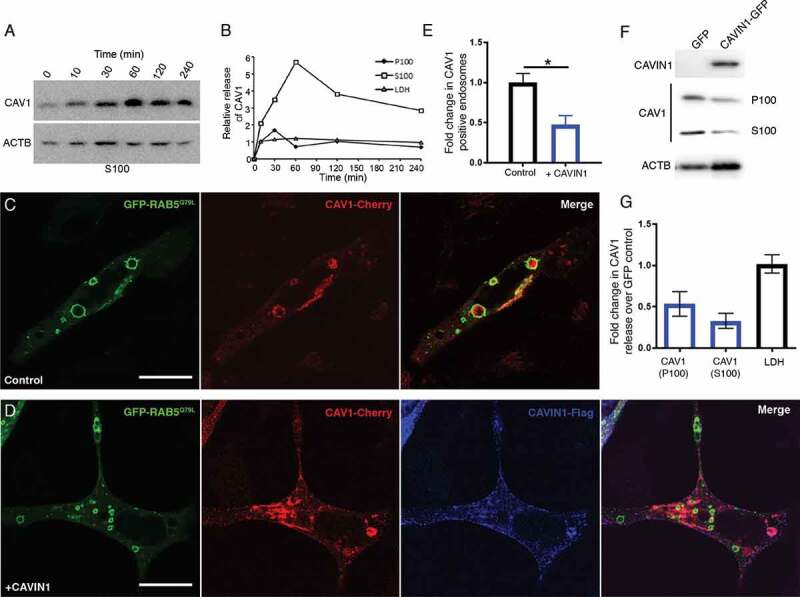
Figure 3.

Regulated release of CAV1 from LNCaP cells. (A) Western blot of CAV1 release from LNCaP cells stimulated with ionomycin. Cells were treated with 500 nM ionomycin in serum free media for various times (0 to 4 h). (B) Peak release of CAV1 was observed after 1 h of treatment. Preferential release of CAV1 in the S100 fraction (compared to the P100 fraction) was observed and did not correlate with the release of LDH. A similar stimulation was observed for PC3 cells (see Fig. S5 A and B). (C) LNCaP cells expressing GFP-RAB5Q79L; CAV1 is sorted into RAB5-positive endosomes in the absence of CAVIN1 expression, scale bar: 10 μm. (D) CAVIN1 expression sequesters and stabilizes CAV1 at the PM within caveolae, scale bar: 10 τm. (E) Western blots of CAV1 levels in the P100 and S100 fractions with or without CAVIN1-GFP expression in LNCaP cells following 16-h serum starvation. (F) Quantification of western blots of the P100 and S100 fractions of CAVIN1 expressing LNCaP cells compared to GFP expression alone. CAVIN1 resulted in a reduction in CAV1 release in both fractions without altering LDH levels. n = 4; error bars represent SEM. We also confirmed that CAVIN1 expression in PC3 cells (also devoid of CAVIN1 expression [6]) reduced internalization and secretion of CAV1 (see Fig. S3). (G) Quantification of CAV1-positive GFP-RAB5Q79L endosomes demonstrates the expression of CAVIN1 significantly reduced the internal pool of CAV1. Statistical significance was determined by two-tailed t tests; p = 0.0011, n = 3, error bars represent SEM
