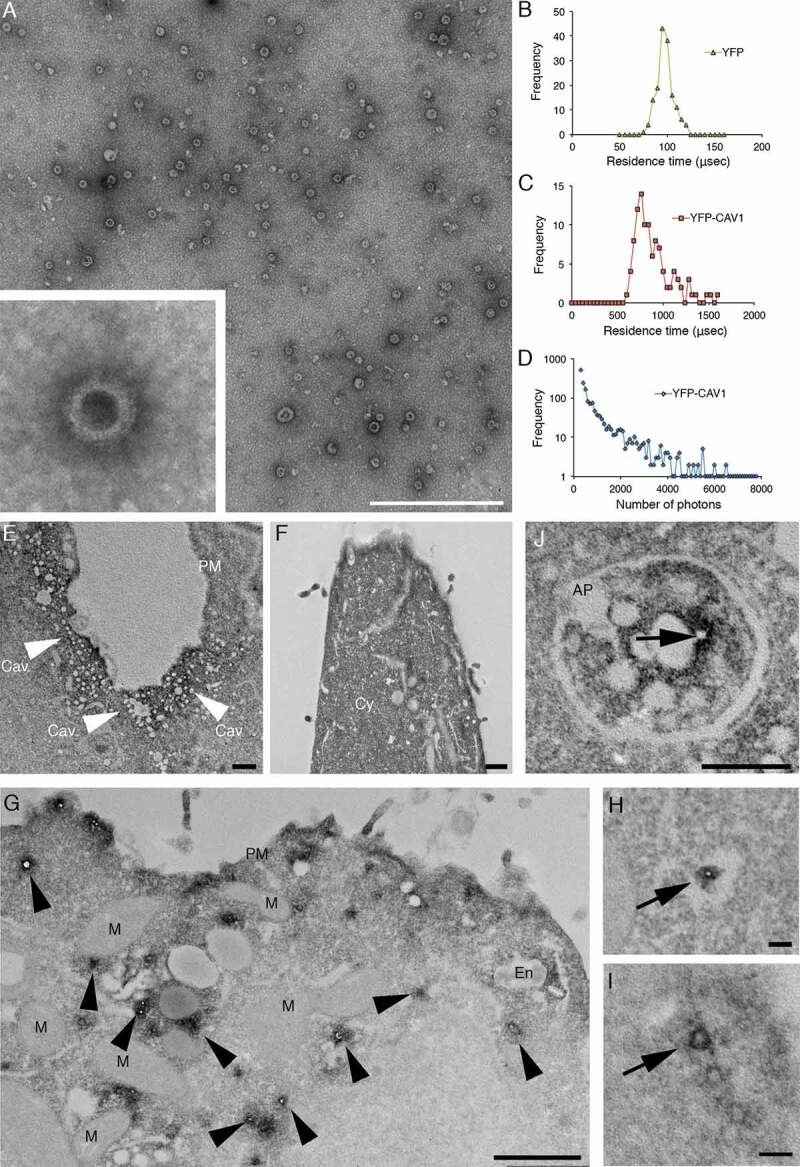
Figure 4.

High-resolution analyses of C-exosomes and YFP-CAV1 in LNCaP cells. (A) EM of YFP-CAV1 isolated from LNCaP media demonstrates particles are regularly shaped vesicles. Inset shows high-magnification image of stained LNCaP particles with a prominent coat on the external leaflet, which includes the YFP fusion and GFP-trap with a maltose binding protein tag. Scale bar: 500 nm. (B-D) Single molecule analysis of YFP-CAV1 released from LNCaP cells. (B) Control analysis of YFP alone demonstrates a residence time of approximately 95 μsec. (C) Analysis of the residence time of YFP-CAV1 demonstrates a 7.5-fold increase in the residence time compared to YFP alone. (D) Plot of burst brightness against the number of bursts of that brightness demonstrates the maximum number of YFP-CAV1 molecules per vesicle to range between 50–60 proteins. (E-I) EM analyses of YFP distribution in cells using APEX-GBP expressing YFP-tagged constructs. (E) Co-expression of YFP-CAV1 and APEX-GBP demonstrates morphologically typical localization of CAV1 in BHK cells at caveolae on the PM of expressing cells. Arrows denote the caveolae with enriched electron density by the association of APEX-GBP. Cav: caveolae, scale bar: 500 nm. F) The co-expression of YFP and APEX-GBP demonstrates a cytoplasmic distribution for YFP alone. Scale bar: 500 nm. G) Lower magnification image of an LNCaP cell transfected with APEX-GBP and YFP-CAV1. Arrowheads highlight small vesicles with very strong reaction products that were absent from BHK cells. PM: plasma membrane, M: mitochondria, En: endosome. H) Small YFP-CAV1 enriched vesicle surrounded by ER. Scale bar: 100 nm. I) High-magnification image of an YFP-CAV1 shows vesicles are membrane bound. Scale bar: 100 nm. J) LNCaP cell expressing YFP-CAV1 and APEX-GBP serum starved to increase basal autophagy prior to fixation. High magnification image showing an autophagosome (AP) completely engulfing a YFP-CAV1 positive vesicle (arrow). Scale bar: 200 nm Electron micrographs are representative images; each LNCaP experiment was independently replicated three times
