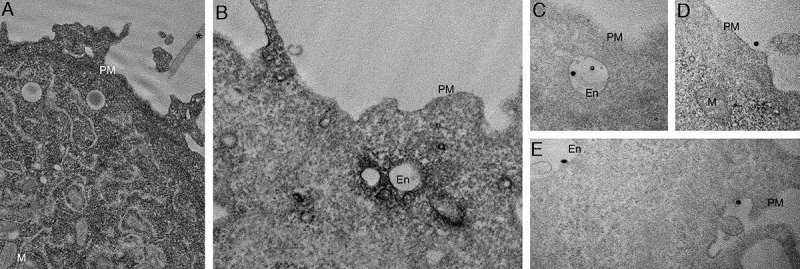
Figure 5.

CAV1 expression in PC3 results in predominantly endosomal localization by APEX-GBP and EM. EM analysis of YFP distribution in cells using APEX-GBP expressing YFP-tagged constructs. (A) The co-expression of YFP and APEX-GBP results in soluble reaction product localized to the cytoplasm of transfected cells. Asterisk denotes the electron density of an untransfected adjacent cell, PM = plasma membrane, M = mitochondria, scale bar: 500 nm. (B) Electron micrograph of a PC3 cell co-transfected with YFP-CAV1 and APEX-GBP. Electron density shows significant enrichment of CAV1 at endosomes (white arrows), the plasma membrane (black arrow) and less frequently small vesicular structures in the cytoplasm (black arrowhead). En: endosome, PM: plasma membrane, scale bar: 500 nm. (C-E) ILVs (white arrowheads) and secreted ILVs/exosomes (red arrowheads) highly enriched with YFP-CAV1 and APEX-GBP inside endosomes and outside the cell. Scale bars: 500 nm. Electron micrographs are representative images; each PC3 experiment was independently replicated two times
