Figure 2.

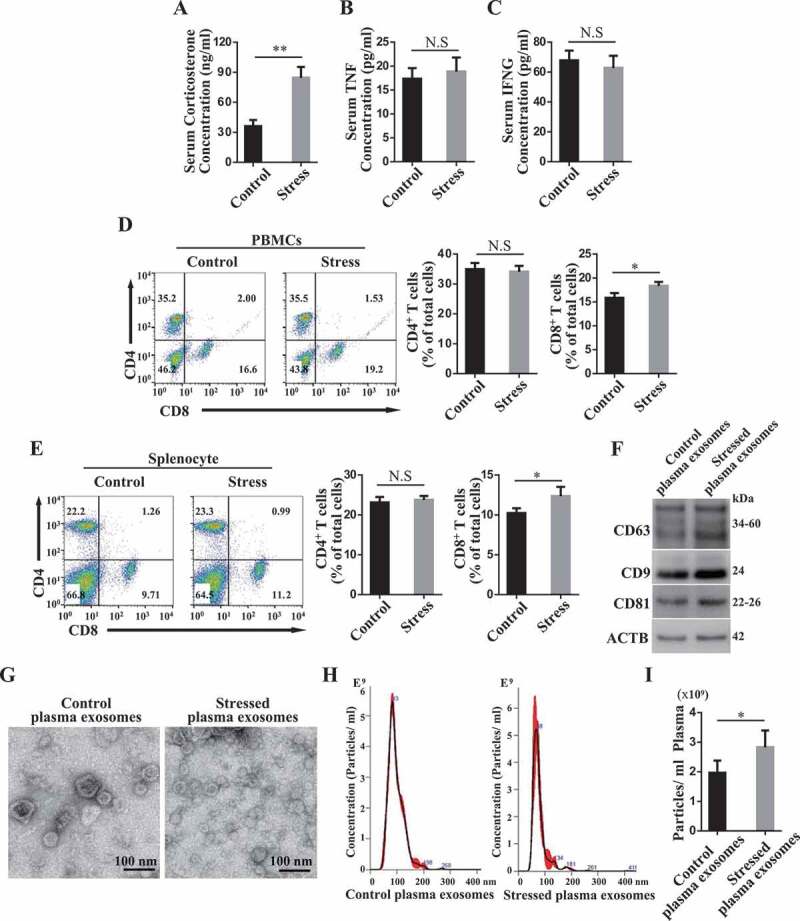
Restraint stress alters circulating exosomes. (A-C) At 3 days after DSS treatment, the levels of corticosterone (A), TNF/TNF-α(B) and IFNG/IFN-γ (C) in serum were determined using ELISA kits at 4 h post-restraint stress. (D, E) The percentages of CD4+ and CD8+ T cells among peripheral blood mononuclear cells (PBMCs) and splenocytes were analyzed using flow cytometry (n = 4 per group). (F) The expression levels of exosome-specific markers CD63, CD9 and CD81 in purified plasma exosomes derived from control and restraint stressed mice were determined by western blotting. (G) The ultrastructure of control and stressed plasma exosomes was observed using transmission electron microscopy (TEM). (H) The size distribution of purified plasma exosomes was investigated using nanoparticle tracking analysis (NAT). (I) NAT showing the concentration of plasma exosomes isolated from control and restraint stressed mice. All results were verified in three independent experiments. A two-tailed Student’s t test was used for statistical analysis. Error bars represent the mean ± s.d. **P < 0.01; *P < 0.05
