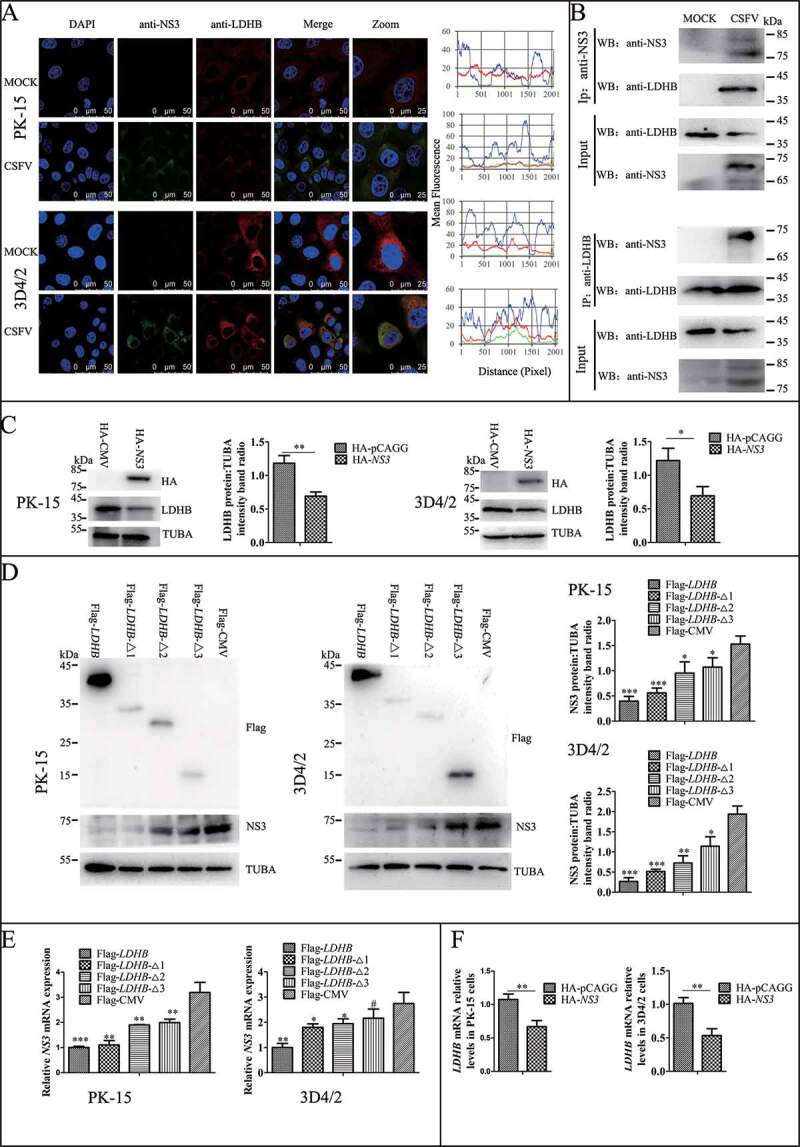
Figure 3.

LDHB interacted with CSFV NS3 and decreased NS3 expression. (A) Colocalization of NS3 protein with LDHB. PK-15 and 3D4/2 cells were mock-infected or infected with CSFV (MOI = 0.1). Cells were fixed at 48 h post-transfection and subjected to indirect immunofluorescence assay to detect NS3 (green) and LDHB (red) with mouse anti-NS3 and rabbit anti-LDHB antibodies. The nucleus is indicated by DAPI (blue) staining in the merged image. Image-Pro Plus6.0 software was used to calculate the mean fluorescence intensity of the line profile of the colocalization image (3 times), the red and green curves showed consistent trends, indicating that the colocalization was resulted from the strong correlation between NS3 and LDHB. (B) CSFV-NS3 antibody and LDHB antibody were used in CSFV infected or non-infected 3D4/2 cells for co-IP experiments, operate as above (Figure 2C). (C) PK-15 and 3D4/2 cells were transduced with the HA-NS3 or pCAGG-HA for 24 h, followed by infected with CSFV at a MOI of 0.1. At 24 hpi, cell samples were analyzed by immunoblotting with antibodies against LDHB, HA and TUBA (loading control). The level of protein was quantified using Image-Pro Plus 6.0 software. Error bars indicate the mean (±SD) of 3 independent experiments. *, P < 0.05; **, P < 0.01; and ***, P < 0.001 (one-way ANOVA). (D) PK-15 and 3D4/2 cells were transduced with the p3xFlag-LDHB, p3xFlag-LDHB-Δ1, p3xFlag-LDHB-Δ2, p3xFlag-LDHB-Δ3 and p3xFlag-CMV for 24 h, followed by infected with CSFV at a MOI of 0.1. At 24 hpi, cell samples were analyzed by immunoblotting with antibodies against NS3, Flag and TUBA (loading control). The level of protein was quantified using Image-Pro Plus 6.0 software. Error bars indicate the mean (±SD) of 3 independent experiments. *, P < 0.05; **, P < 0.01; and ***, P < 0.001 (one-way ANOVA). (E) After transfected with targeted plasmid 24 hpi, the LDHB or NS3 mRNA expression in PK-15 and 3D4/2 cells were assessed using a real-time RT-PCR assay as described in Materials and Methods. Error bars indicate the mean (±SD) of 3 independent experiments. *, P < 0.05; **, P < 0.01; and ***, P < 0.001 (one-way ANOVA)
