
Figure 5.
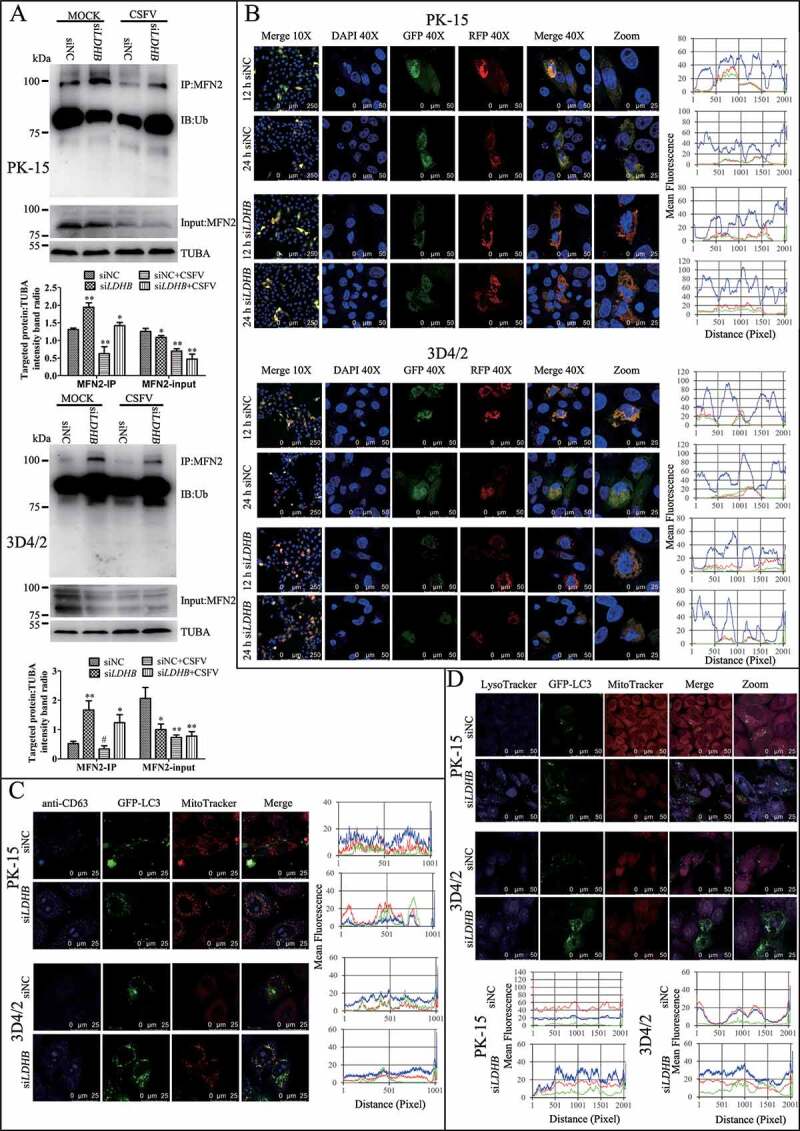
LDHB inhibition induced complete mitophagy. (A) The level of MFN2 ubiquitination in PK-15 and 3D4/2 cells that transfected with siNC or siLDHB and were mock-infected or infected with CSFV (MOI = 0.1) for 24 h. The immunoprecipitation (IP) of MFN2 was confirmed by immunoblotting with anti-MFN2 antibody. The ubiquitinated MFN2 was analyzed by immunoblotting with anti-Ub antibody. In addition, expression of MFN2 in PK-15 and 3D4/2 cells evaluated by immunoblotting was used as the input control. TUBA was used as an internal loading control. (B) PK-15 and 3D4/2 cells transiently expressing Mito-mRFP-EGFP were transfected with siNC or siLDHB for 24 h. In the zoomed images, fluorescence signals indicated the expression of mRFP and GFP protein targeting mitochondria: yellow color, no mitophagy; red color, mitophagy. Image-Pro Plus 6.0 software was used to measure the fluorescence intensity quantitative analysis. (C) PK-15 cells transiently expressing EGFP-LC3 protein were transfected with siNC or siLDHB for 24 h. After staining the mitochondria with MitoTracker (red), cells were immunostained with CD63 antibodies (blue). Image-Pro Plus 6.0 software was used to measure the fluorescence intensity quantitative analysis. (D) PK-15 and 3D4/2 cells transiently expressing EGFP-LC3 protein were transfected with siNC or siLDHB for 24 h. Cells were stained the mitochondria with MitoTracker (red) and the lysosome with LysoTracker (Blue). Image-Pro Plus6.0 software was used to calculate the mean fluorescence intensity of the line profile of the merge image (3 times)