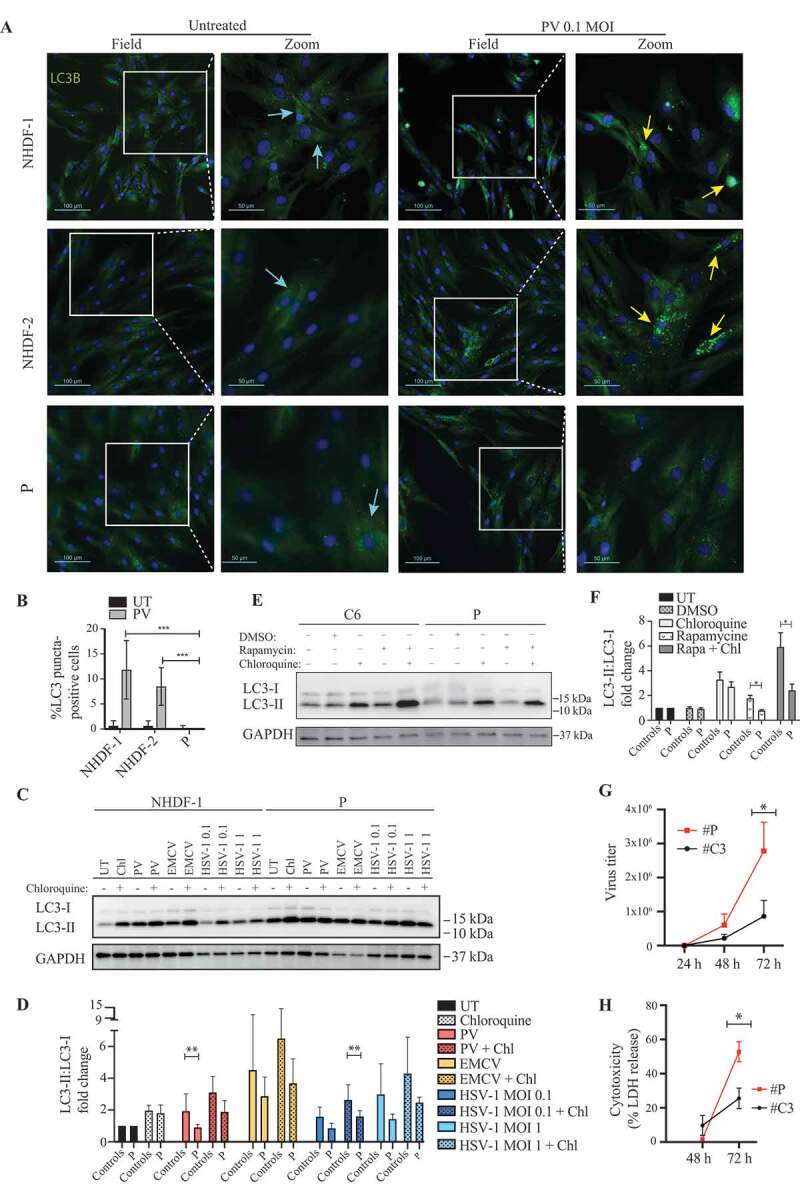
Figure 3.

Impaired LC3-I to LC3-II conversion and viral control in patient fibroblasts heterozygous for the ATG7A388T variant. (A) Immunofluorescence images of primary fibroblasts stained for LC3 (green), and 49-6-diamidino-2-phenylindole dihydrochloride (DAPI) (blue) following 24 h of PV infection at 0.1 MOI. Turquoise arrows indicate cytoplasmic LC3 (LC3-I), and yellow arrows indicate autophagosome-associated LC3 (LC3-II). (B) Quantification of the data shown in (A). Similar results were obtained following 48 h (Figure S2A-B), data are shown with SD, n = 3, nonparametric Mann-Whitney rank sum test was used for statistical analysis. The number of LC3 puncta-positive cells was quantified based on a minimum of three different pictures (from different regions of the slide) and 100 cells per slide. (C) Western blotting for LC3 and GAPDH on lysates from primary fibroblasts from P and three controls infected for 24 h with PV (MOI 50) EMCV (MOI 0.1), HSV-1 (MOI 0.1 or 1) and/or stimulated with 20 μm chloroquine 4 h prior to lysing. Western blot showing the patient and one control representative of the three independent experiments is shown. (D) Quantification of the three experiments from (C), data are shown with SEM, n = 3, nonparametric Mann-Whitney rank sum test was used for statistical analysis (E) Western blotting for LC3 and GAPDH on lysates from primary fibroblasts from P and 3 controls stimulated with 500 nM rapamycin for 12 h with and/or chloroquine 4 h prior to cell lysis l. Western blot showing the patient and one control representative of the three independent experiments is shown. (F) Quantification of the three experiments from (E), data are shown with SEM, n = 3, nonparametric Mann-Whitney rank sum test was used for statistical analysis. (G) SV40-immortalized fibroblasts were infected with PV at an MOI of 0.1 and supernatants were harvested at the indicated time points for measurement of viral yield. Data are shown with SEM, n = 3, nonparametric Mann-Whitney rank sum test was used for statistical analysis. Results were confirmed in primary fibroblast using four different controls (Figure S2G-H). (H) SV40-immortalized fibroblasts were infected with PV at an MOI of 0.1 and supernatants were isolated 48 and 72 h post infection and subjected to LDH release assay. Data are shown with SEM, n = 3, nonparametric Mann-Whitney rank sum test was used for statistical analysis. All experiments were performed at least three times. UT, untreated; Rapa, rapamycin; DMSO, dimethylsulfoxide; Chl, chloroquine; EMCV, encephalomyocarditis virus; HSV, herpes simplex virus; PV, poliovirus. # indicates SV40 immortalized cells. *, p ≤ 0.05; **, p ≤ 0.01; ***, p ≤ 0.001; ****, p ≤ 0.0001
