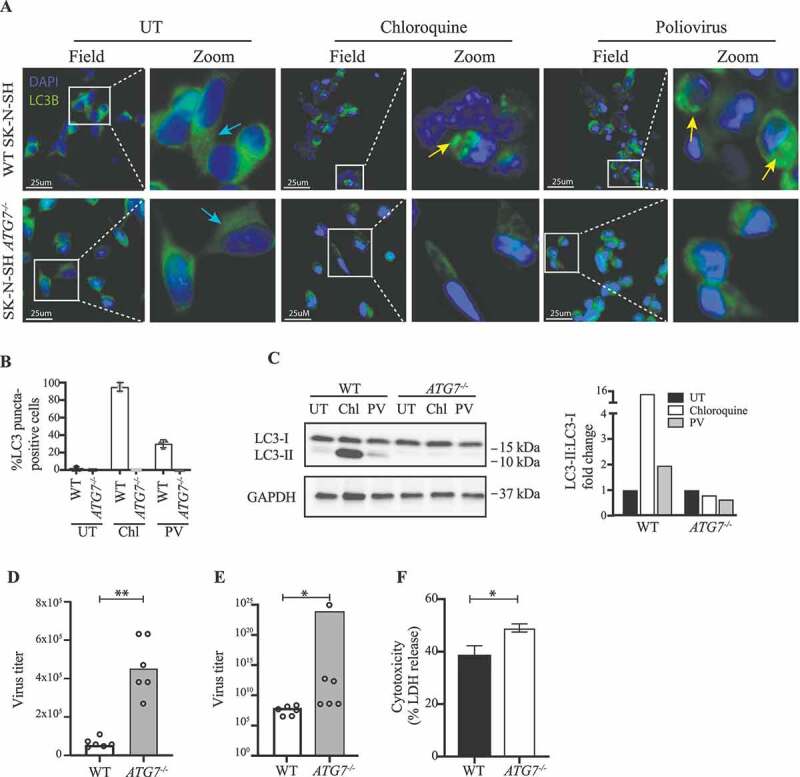
Figure 4.

Impaired viral control in SK-N-SH ATG7−/- neuronal-like cell line. (A) Immunofluorescence images of neuronal-like SK-N-SH cells stained for LC3 (green), and 49-6-diamidino-2-phenylindole dihydrochloride (DAPI) (blue). Cells were infected with PV at an MOI of 50 or stimulated with 50 nM chloroquine for 6 h. Turquoise arrows indicate cytosolic LC3 (LC3-I), and yellow arrows indicate autophagosome-associated LC3 (LC3-II). Images representative of the four different clones are shown. (B) Quantification of (A). The number of LC3 puncta-positive cells was quantified based on a minimum of three different pictures (from different regions of the slide) and 100 cells per slide. (C) Cell lysates were prepared from WT SK-N-SH and SK-N-SH ATG7−/- cells and immunoblotting for LC3 was performed. Western blots and quantification representative of 2 different clones. (D) Cell lines were infected with PV at an MOI of 10 and supernatants were harvested 8 h post infection. All data points are shown with bar line at mean, n = 2, nonparametric Mann-Whitney rank sum test was used for statistical analysis. (E) Cell lines were infected with PV at an MOI of 0.1 and supernatants were harvested 24 h post infection. Data representing all data points from two independent experiments are shown with bar line at mean, n = 3, nonparametric Mann-Whitney rank sum test was used for statistical analysis. Similar results were obtained for six different clones (Figure S4A). (F) Cell lines were infected with PV at an MOI of 0.1. Following 24 h supernatants were subjected to LDH release assay. Data are shown with SD, n = 2, nonparametric Mann-Whitney rank sum test was used for statistical analysis. Similar results were obtained in four different clones (Figure S4B). UT, untreated; Chl, chloroquine 50 nM; PV, poliovirus; WT, wild-type. *, p ≤ 0.05; **, p ≤ 0.01; ***, p ≤ 0.001; ****, p ≤ 0.0001
