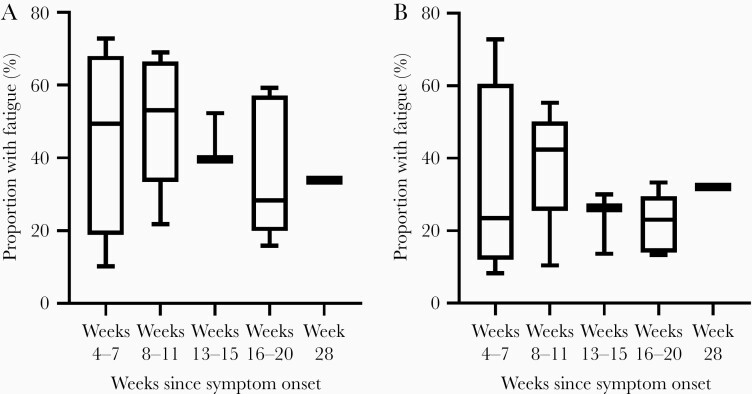
Figure 2.
Prevalence of fatigue in COVID-19 from cross-sectional studies. The box extends from the 25th to 75th percentiles, the line represents the median, and the whiskers show the minimum and maximum. Week 28 is represented by a single study. (A) shows the original rates reported by the included studies. The proportion of patients reporting fatigue were as follows: 10%–73% at 4–7 weeks [17, 23, 24, 28], 22%–69% at 8–11 weeks [13, 15, 21, 22, 26], 39%–52% at 12–15 weeks [12, 18, 19], 16%–59% at 16–20 weeks [14, 16, 20, 25, 27], and 34% at 28 weeks from symptom onset [29]. (B) shows these rates recalculated with all eligible individuals included in the denominator: 8%–24% at 4–7 weeks [17, 23, 24, 28], 10%–55% at 8–11 weeks [13, 15, 21, 22, 26], 14%–26% at 12–15 weeks [12, 18, 19], 13%–33% between weeks 16 and 20 [14, 16, 20, 25, 27], and 32% at 28 weeks from symptom onset [29].

