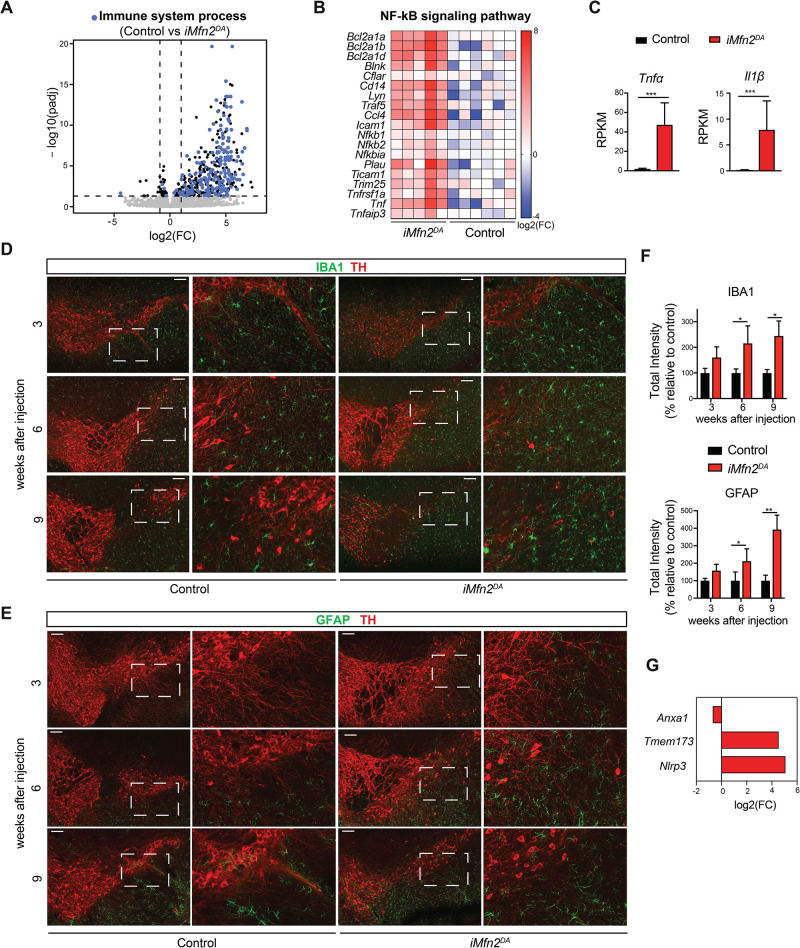
Fig 5. Activation of glial cells surrounding DA neurons in in tamoxifen-injected iMfn2DA mice.
(A) Volcano plot displaying differential gene expression in iMfn2DA FACS-sorted DA neurons: the 439 differentially expressed genes are represented in black and blue. The genes involved in the immune response are represented in blue. (B) Heatmap showing the gene expression of NF-kB signaling pathway in DA neurons isolated from iMfn2DA and control mice. (C) RNA expression levels (RPKM) of the inflammation markers Tnf-α and IL1β in mitoYFP+ cells from iMfn2DA and control mice. Data are shown as mean ± SD. (D-E). Representative confocal microscopy image of control and iMfn2DA mouse brains at 3, 6, and 9 weeks after injection. DA neurons were labelled with an antibody against TH (red) and the brain sections were additionally labelled with antibody against IBA1 (green) in panel (D) or GFAP (green) in panel (E) (Scale bars: 100 μm). (F) IBA1 and GFAP immunoreactivities quantified as total intensity in the stained areas of the midbrain from control and tamoxifen-injected iMfn2DA mice at 3, 6 and 9 weeks after injection. Data are shown as mean ± SD. n≥3.*p< 0.05, **p<0.01. (G) Log2(FC) of RNA expression of genes involved in signaling pathways that potentially could drive neuroinflammation in iMfn2DA mice.

