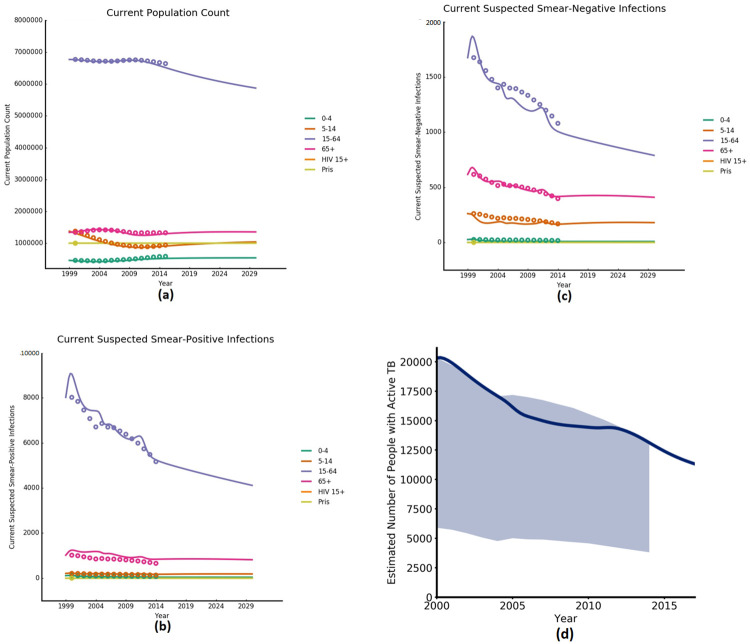
Fig 3. Calibration output graphs.
(a) Datapoints are UN Population Division estimates (2000–2015) [49], (b) and (c) datapoints are WHO active TB prevalence upper-bound estimates disaggregated by population group (2000–2014) [53] and (d) shaded area represents confidence intervals of WHO active TB prevalence estimates for total population (2000–2014) [53].

