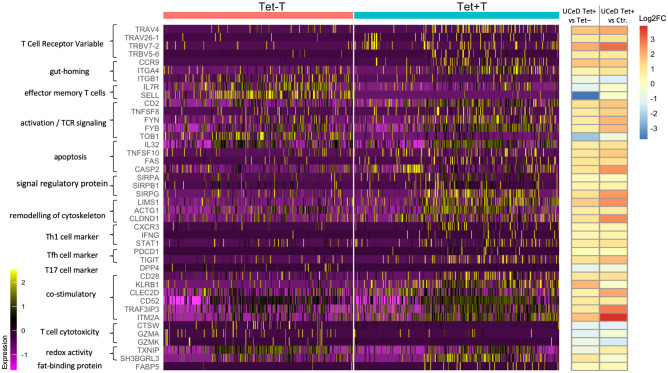
Fig 2. Heatmap of selected genes organized by function.
The color represents the scaled value of gene expression, where each gene has a mean close to 0 and a standard deviation of 1. All genes listed are differentially expressed with FDR < 0.05. On the right, the 1st column of log2FC represents the average log2 fold change expression of the genes for tetramer-positive versus tetramer-negative effector memory CD4+ T cells from CD patients. The 2nd column represents the average log2 fold change expression of the genes for tetramer-positive effector memory CD4+ T cells from CD patients versus effector memory CD4+ T cells from healthy donors.

