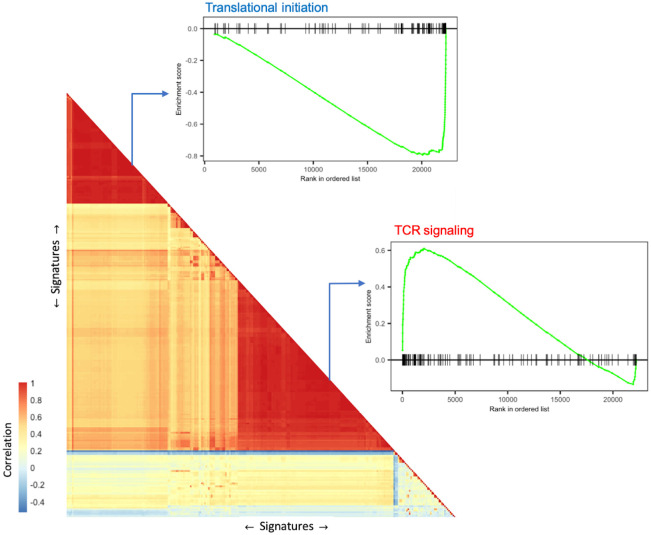
Fig 3. Significantly enriched signatures (gene sets) clustered based on the correlation of signature scores produced by VISION.
For each of the two main clusters (one down-regulated and one up-regulated), an enrichment plot was provided for one selected signature with both high significance in gene set enrichment analysis and high level in the hierarchical database structure, e.g. the Reactome or GO biological process hierarchy.

