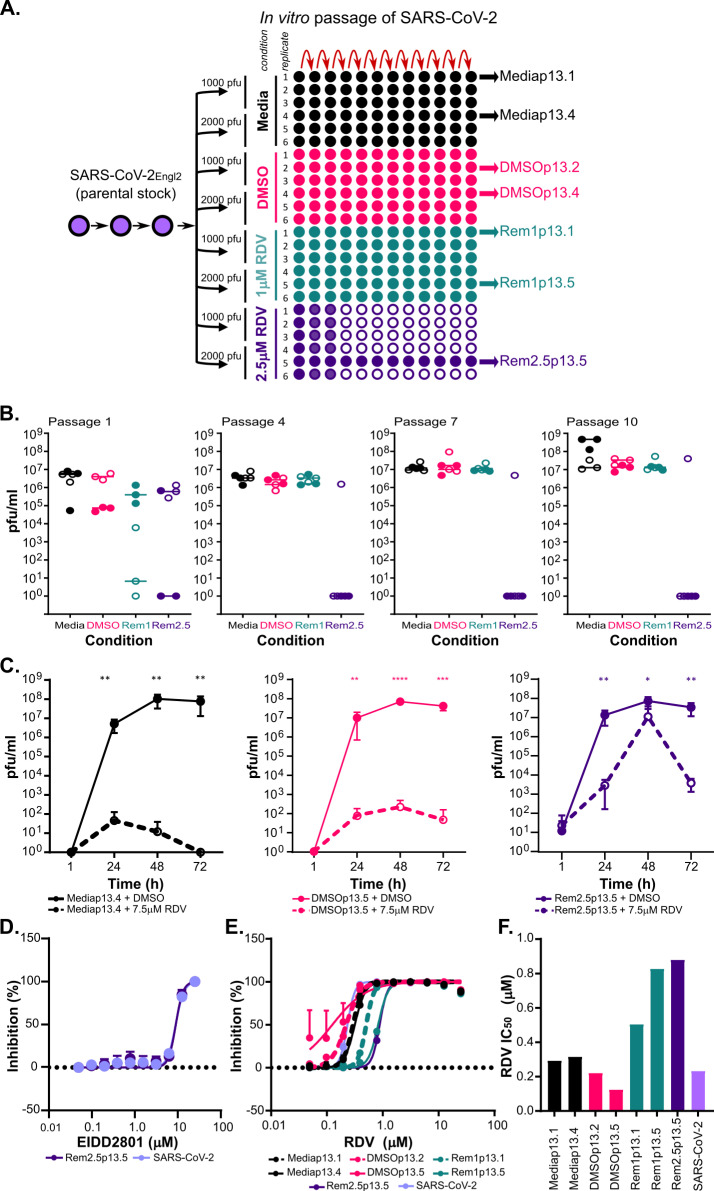
Fig 1. Continuous passage of SARS-CoV-2Engl2 in RDV selects for partial resistant populations.
(A) Schematic of the experimental layout to select for RDV resistant viruses. The passage (p) number of the input virus SARS-CoV-2Engl2 is given. We consider p1 as the stock supplied by Public Health England, it was passaged twice in VeroE6 prior to selection in RDV. SARS-CoV-2Engl2 p3 is the input stock that was sequenced and used for analysis. Each condition is given a different colour and the amount of virus used at the start of the experiment is indicated. Populations that failed to amplify (no CPE or/and virus titre) are indicated by the empty circles. All lineages sequenced are indicated. (B) Virus titers (pfu/ml) at p1, p4, p7 and p10. 6 lineages per condition and two different virus inputs; 1000 pfu (solid circle) and 2000 pfu (open circle). Median for each is shown. (C) Virus growth kinetics in VeroE6 in the presence (dashed line) or absence (solid line) of 7.5μM RDV for 3 different virus populations. Data is from 2 independent experiments with 3 replicates. Error bars represent SEM. Unpaired t-tests (Holm-Šídák method; *,P< 0.05; **,P< 0.01; ***,P< 0.001. ****, P<0.0001). (D) EIDD2801 dose dependency curve. EIDD2801 treated VeroE6-ACE2-TMPRSS2 infected with 8400 pfu/ml of each virus. (E) RDV dose dependency curves determined in A549NPro-ACE2 infected with 8400 pfu/ml of each virus. (F) Bar graph of RDV EC50 for different viruses in A549NPro-ACE2 with 8400 pfu/well. For all panels, error bars represent SEM.

