FIGURE 2.

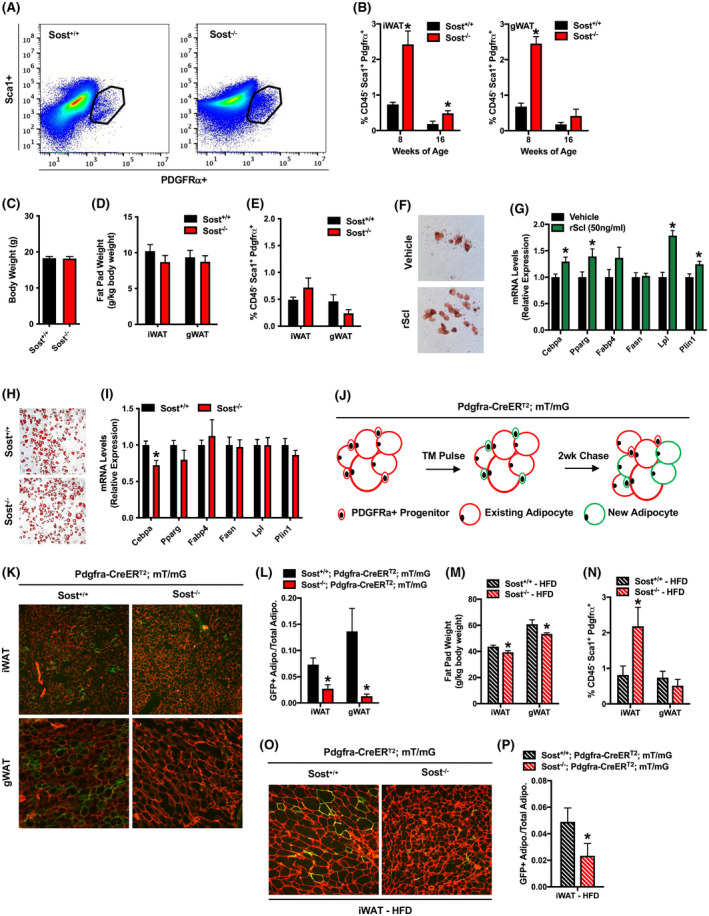
Sclerostin deficiency inhibits the differentiation of adipoprogenitor cells. (A) Representative flow cytometry plot of CD45−:Sca1+:PDGFRα+ APCs isolated from the inguinal fat pad of Sost+/+ and Sost−/− mice. (B) Quantification of CD45−:Sca1+:PDGFRα+ APCs in the inguinal (iWAT, left panel) and gonadal (gWAT, right panel) fat pads of 8‐ and 16‐week‐old male Sost+/+ and Sost−/− mice (n = 4–6 mice/genotype). (C–E) Assessment of body weight (C), fat pad weight (D) and the abundance of CD45−:Sca1+:PDGFRα+ APCs in the iWAT and gWAT of 8‐week‐old female Sost+/+ and Sost−/− mice (n = 7–9 mice/genotype). (F and G) In vitro differentiation of CD45−:Sca1+:PDGFRα+ APCs isolated from the inguinal fat pad and treated with vehicle or recombinant mouse sclerostin (rScl, 50 ng/ml) was assessed by Oil Red O staining (F) and qPCR analysis (G, n = 4 cell isolations). (H and I) In vitro differentiation of identical numbers (80,000 cells/well) of CD45−:Sca1+:PDGFRα+ APCs isolate from the inguinal fat pads of male Sost+/+ and Sost−/− mice was assessed by Oil Red O staining (H) and qPCR analysis (I, n = 3–4 cell isolations). (J) Experimental design for lineage tracing experiments. 7‐week‐old Pdgfra‐CreERT2:mT/mG mice were treated with tamoxifen on five consecutive days (TM Pulse). Tissues were harvested 14 days (2 wk Chase) after the last tamoxifen injection. (K) Fluorescent micrographs of mRFP and mGFP expression in the iWAT and gWAT of Pdgfra‐CreERT2:mT/mG mice expressing or lacking sclerostin. (L) Quantification of the ratio of mGFP+ adipocytes to total adipocytes from lineage tracing studies (n = 4–6 mice/genotype). (M and N) Fat pad weight (M) and quantification of the CD45−:Sca1+:PDGFRα+ APC pool (N) in male Sost+/+ and Sost−/− mice fed a high‐fat diet for 6 weeks (n = 8–9 mice/genotype). (O) Fluorescent micrographs of mRFP and mGFP expression in the iWAT of high‐fat diet fed mice. (P) Quantification of the ratio of mGFP+ adipocytes to total adipocytes from HFD lineage tracing studies (n = 4–6 mice/genotype). All data are represented as mean ± SEM. *p < .05
