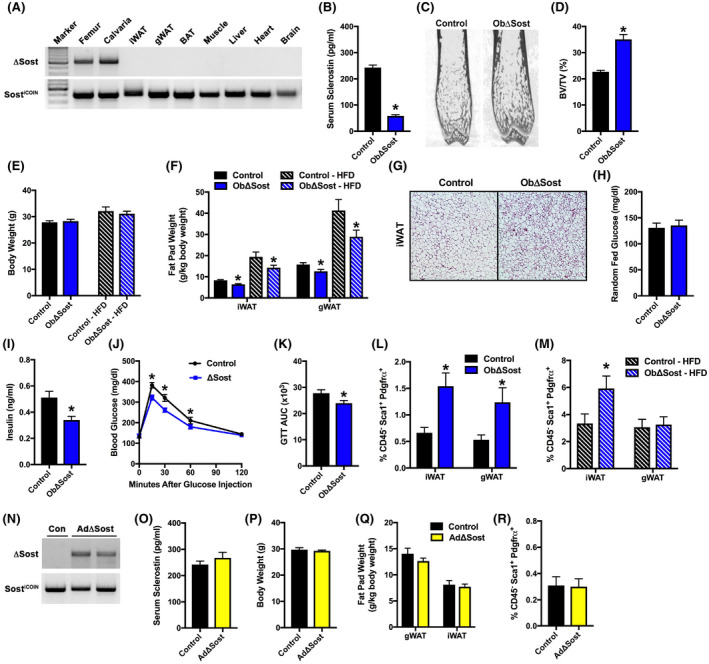
FIGURE 4.

Osteoblast/osteocyte‐derived sclerostin regulates PDGFRα+ adipoprogenitor cell behavior. (A) PCR analysis of Sost gene recombination in tissues of male, 12‐week‐old osteoblast‐specific Sost knockout (ObΔSost) mice. (B) Serum sclerostin levels in male, 12‐week‐old control and osteoblast/osteocyte‐specific Sost knockout (ObΔSost) mice (n = 6–8 mice/genotype). (C and D) Representative microCT images and quantification of bone volume per tissue volume in the distal femur of control and ObΔSost mice (n = 8–9 mice/genotype). (E) Body weight of control and ObΔSost mice fed a chow or high‐fat diet (HFD, 8 weeks on diet) (n = 9–13 mice/genotype). (F) Gonadal (gWAT) and inguinal (iWAT) fat pad weight (n = 9–13 mice/genotype). (G) Representative iWAT histological sections. 10× magnification. (H and I) Random fed blood glucose and serum insulin levels (n = 6–9 mice/genotype). (J and K) Glucose tolerance (GTT) and area under the curve (AUC) analysis (n = 8–10 mice/genotype). (L and M) Quantification of CD45−:Sca1+:PDGFRα+ adipoprogenitors in iWAT of chow‐fed (L) and HFD‐fed (M) mice (n = 9–13 mice/genotype). (N) PCR analysis of Sost gene recombination in the iWAT of male, 12‐week‐old control (Con) and adipocyte‐specific Sost knockout (AdΔSost) mice. (O) Serum sclerostin levels (n = 7–8 mice/genotype). (P) Body weight (n = 7–8 mice/genotype). (Q) Gonadal and inguinal fat pad weight (n = 7–8 mice/genotype). (R) Quantification of CD45−:Sca1+:PDGFRα+ adipoprogenitors in iWAT (n = 7–8 mice/genotype). All data are represented as mean ± SEM. *p < .05
