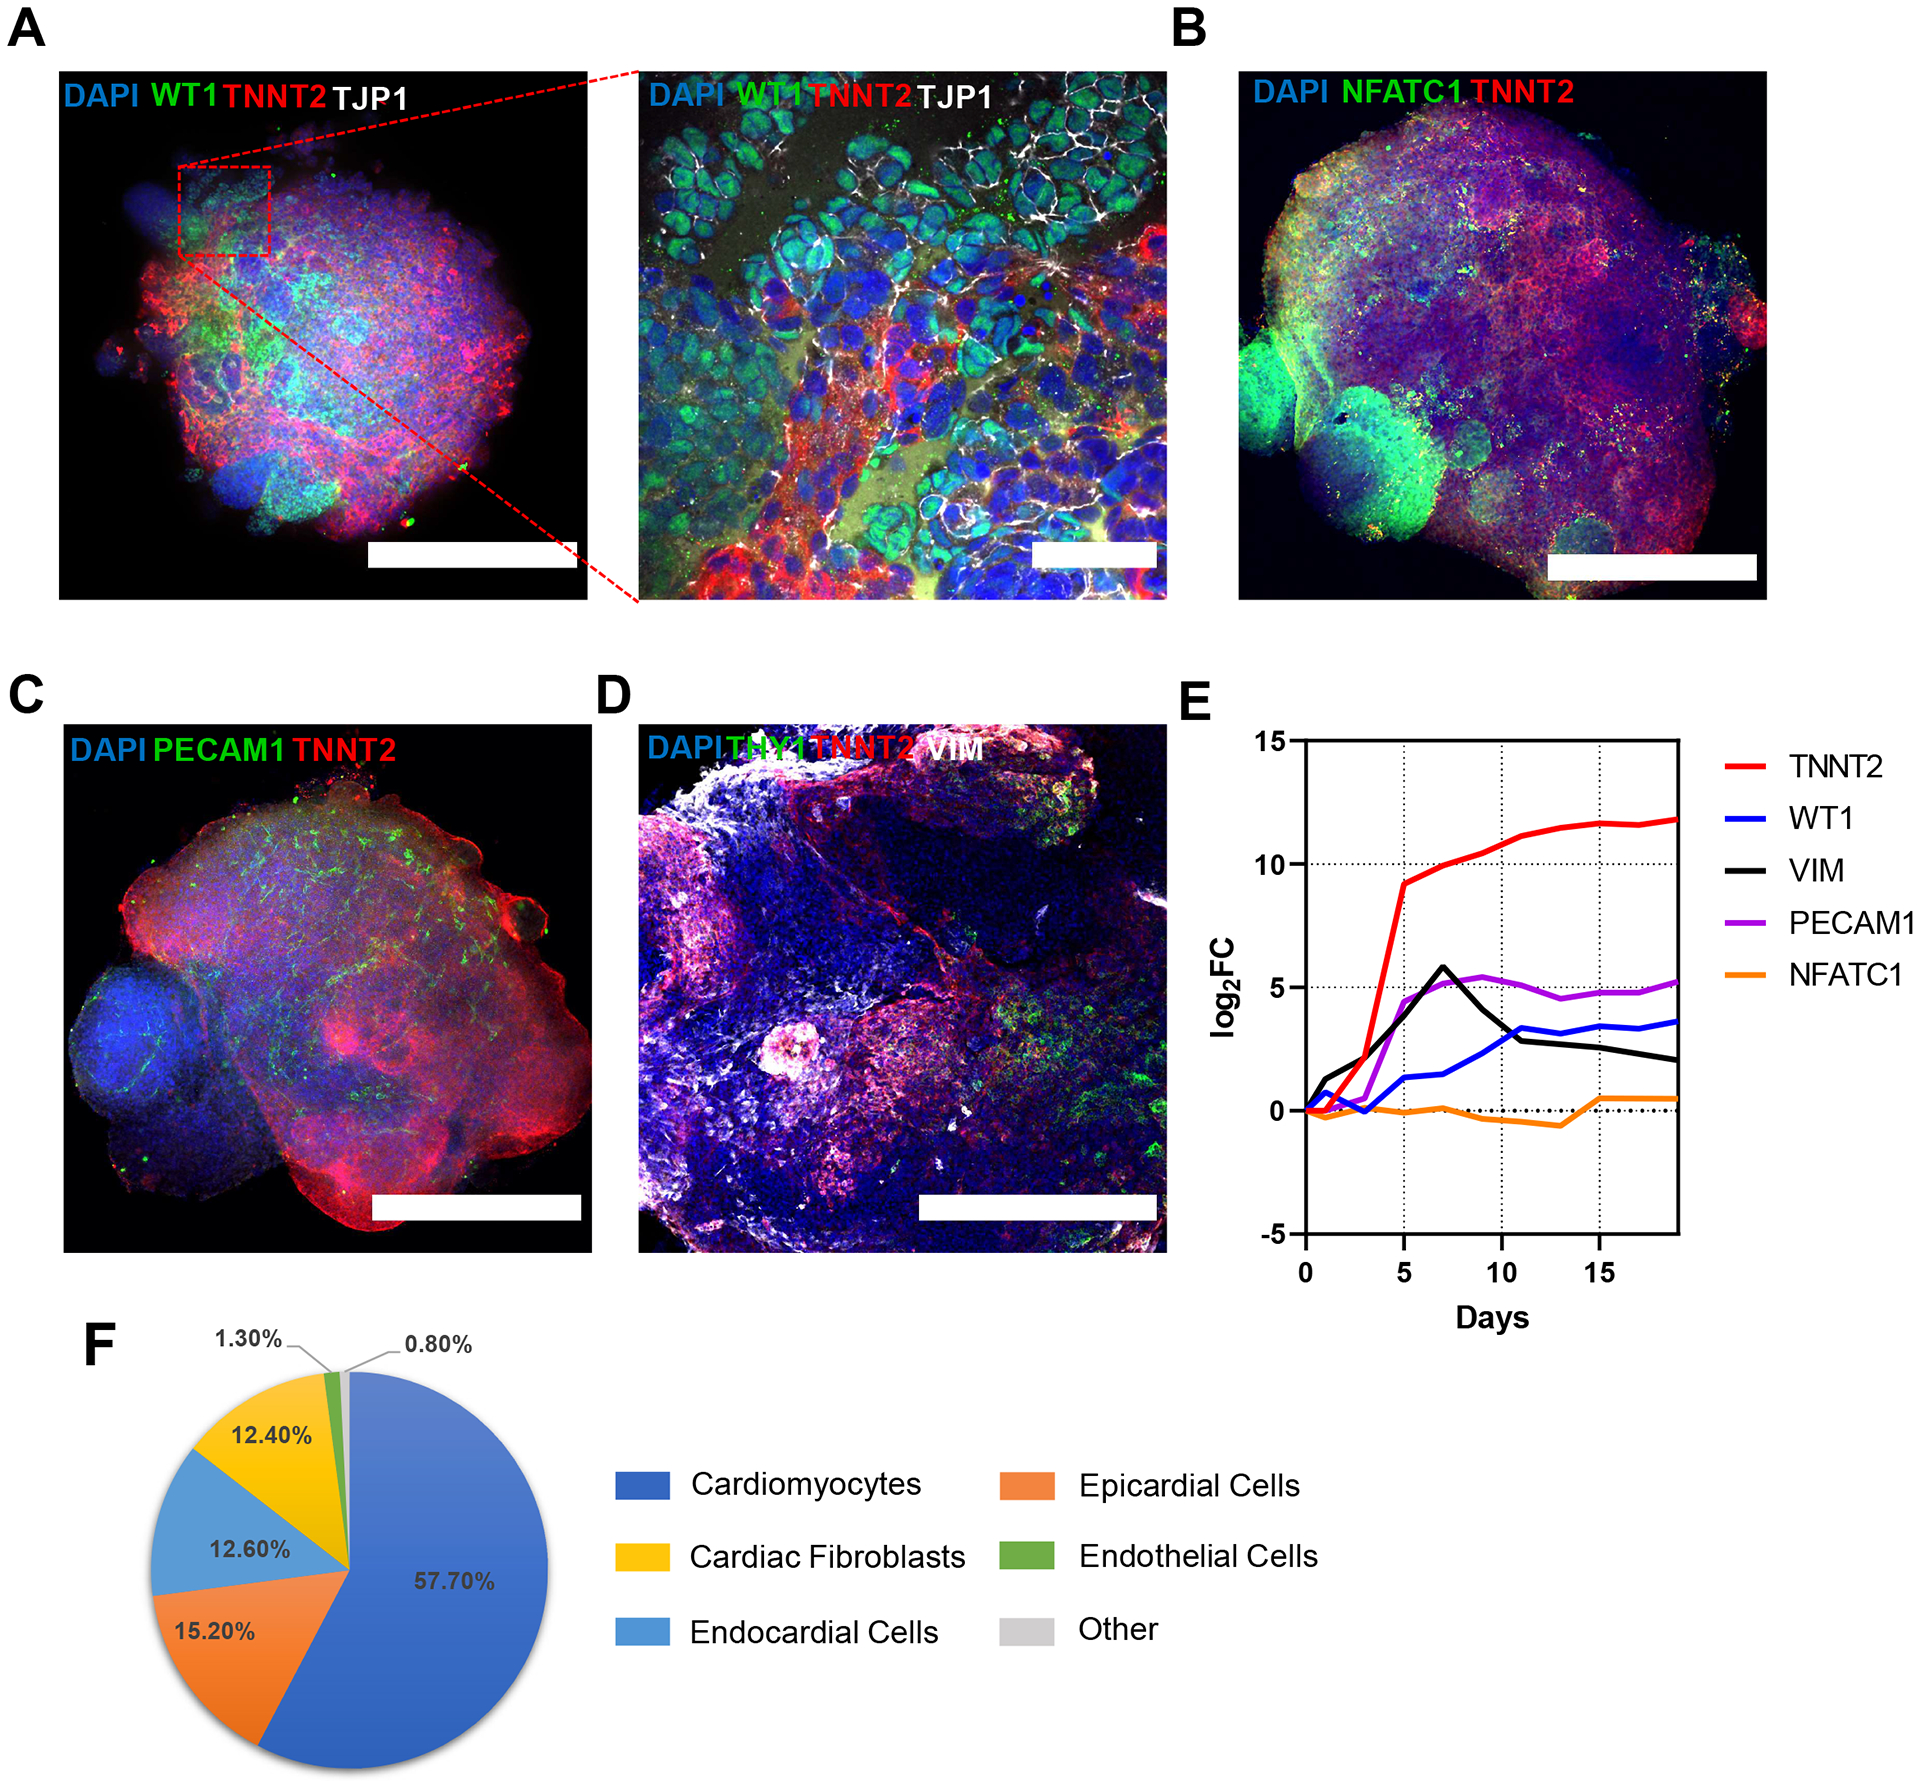
Figure 4: hHOs develop multiple cardiac lineages.

(A–D) Confocal immunofluorescence images of day 15 hHOs showing the formation of cardiomyocytes (TNNT2) and staining with nuclear dye DAPI in non-myocyte cardiac cells. (A) Whole organoid and high magnification of epicardial marker WT1 (green) and epithelial membrane marker TJP1 (white) showing epicardial cells of epithelial origin on top and adjacent to myocardial tissue; scale bar = 500 μm, inset = 50 μm. (B) Endocardial marker NFATC1 (green) expression on the lining of chambers; scale bar = 500 μm. (C) Endothelial vessel network in hHOs shown by PECAM1 (green). Scale bar = 500 μm. (D) Cardiac fibroblasts markers THY1 and VIM shown in green and white, respectively, distributed throughout the organoid. Scale bar = 500 μm. (E) RNA-Seq gene expression profiles of the major cell types present in the hHOs from days 0 to 19 of differentiation. Abbreviations: hHOs = human heart organoids; TNNT2 = cardiac troponin T2; DAPI = 4’,6-diamidino-2-phenylindole; WT1 = Wilm’s tumor-1 transcription factor; NFATC1 = cytoplasmic nuclear factor of activated T cell; PECAM1 = platelet endothelial cell adhesion molecule-1; VIM = vimentin. (F) Pie chart of average tissue type composition in hHOs, calculated as the percentage area with respective cell marker over entire organoid by nuclei staining across three z-planes throughout each organoid using ImageJ.
