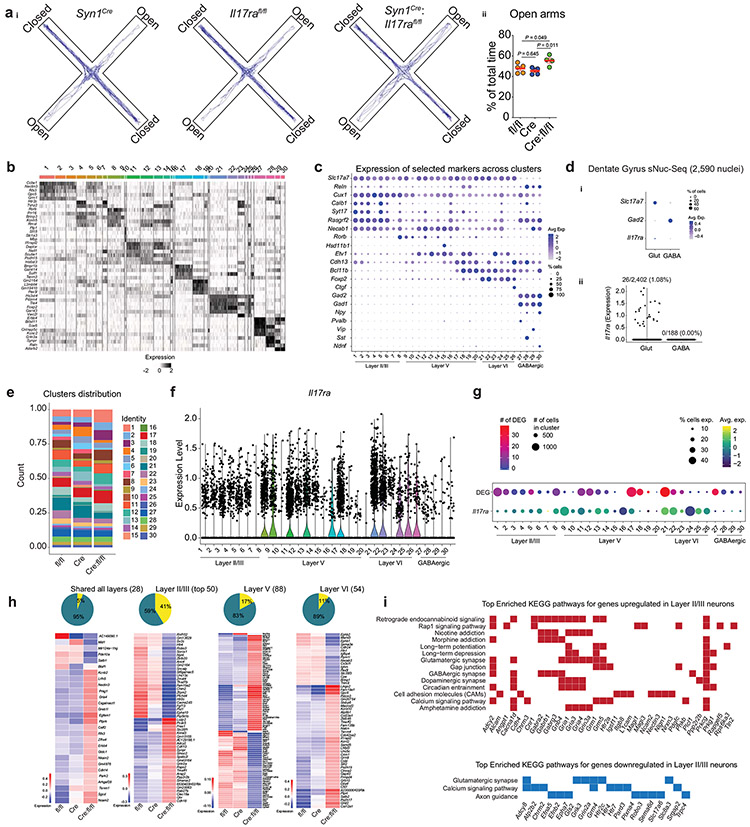
Extended Data Fig. 6. Neuronal loss of IL-17a signaling changes the transcriptional landscape of mPFC neurons.
ai, Representative track plots of the cumulative total distance of Syn1Cre, Il17rafl/fl and Syn1Cre:Il17rafl/fl tested in the elevated plus maze test just before nuclei isolation for the scRNA-Seq experiment. aii, Percentage of total time spent in the open arms. Il17rafl/fl (n = 5); Syn1Cre (n = 5); and Syn1Cre:Il17rafl/fl (n = 4). Data represents one single experiment. Il17rafl/fl vs. Syn1Cre:Il17rafl/fl, P = 0.049; Syn1Cre vs. Syn1Cre:Il17rafl/fl; P = 0.011; One-way analysis of variance (ANOVA) followed by Bonferroni's multiple comparisons test. b, Heatmap showing cluster signatures across all mPFC nuclei. Each line represents the scaled expression of the corresponding gene within each nucleus, with more highly expressed genes shown in black. The top five most highly expressed genes from each cluster (compared against all other clusters) are shown. c, Dot plot showing the expression of canonical neuronal subclass markers across each of our Seurat identified clusters. Color represents the scaled average expression and size indicates the percentage of cells within each cluster expressing the gene. di, Dot plot showing the expression of Slc17a7, Gad2 and Il17ra among 2,590 nuclei isolated from the mouse hippocampus (dentate gyrus). Color represents the scaled average expression and size indicates the percentage of cells within each cluster expressing the gene. dii, violins show the normalized expression of Il17ra within each cell across clusters. e, Bar graph showing the proportion of cells from each sample belonging to each cluster across all mPFC nuclei. f, Violins show the normalized expression of Il17ra within each cell across clusters. g, Dot plot showing information about each cluster. In the top row, dot size indicates the total number of cells belonging to the cluster and color indicates the number of differentially expressed genes (DEG) overlapping between Syn1Cre:Il17rafl/fl vs. Syn1Cre and Syn1Cre:Il17rafl/fl vs. Il17rafl/fl (adjusted p value < 0.05, absolute log fold change > 0.1). In the second row, the size of the dot shows the percentage of cells within the cluster expressing Il17ra while the color represents the scaled average expression of Il17ra across cells in the cluster. h, Heatmaps showing overlapping differentially expressed genes between Syn1Cre:Il17rafl/fl vs. Syn1Cre and Syn1Cre:Il17rafl/fl vs. Il17rafl/fl that are significantly changed in all three layer subsets (far left), the top 50 (based on absolute average log fold change) differentially expressed genes that changed uniquely in Layer II/III (left), and the significantly differentially expressed genes that were uniquely changed in Layer V (right) and Layer VI (far right) with the loss of functional Il17ra. Above each heatmap is a pie chart showing the percentage of significantly differentially expressed genes combined across all layers, that belong to each category described (shared, unique to Layer II/III, unique to Layer V, or unique to Layer VI). i, Plots showing the most significantly enriched KEGG pathways based on the set of significantly up- (top) or down- (bottom) regulated genes shared between Syn1Cre:Il17rafl/fl vs. Syn1Cre and Syn1Cre:Il17rafl/fl vs. Il17rafl/fl with colored squares indicating the contribution of each gene to the corresponding enriched pathway.

