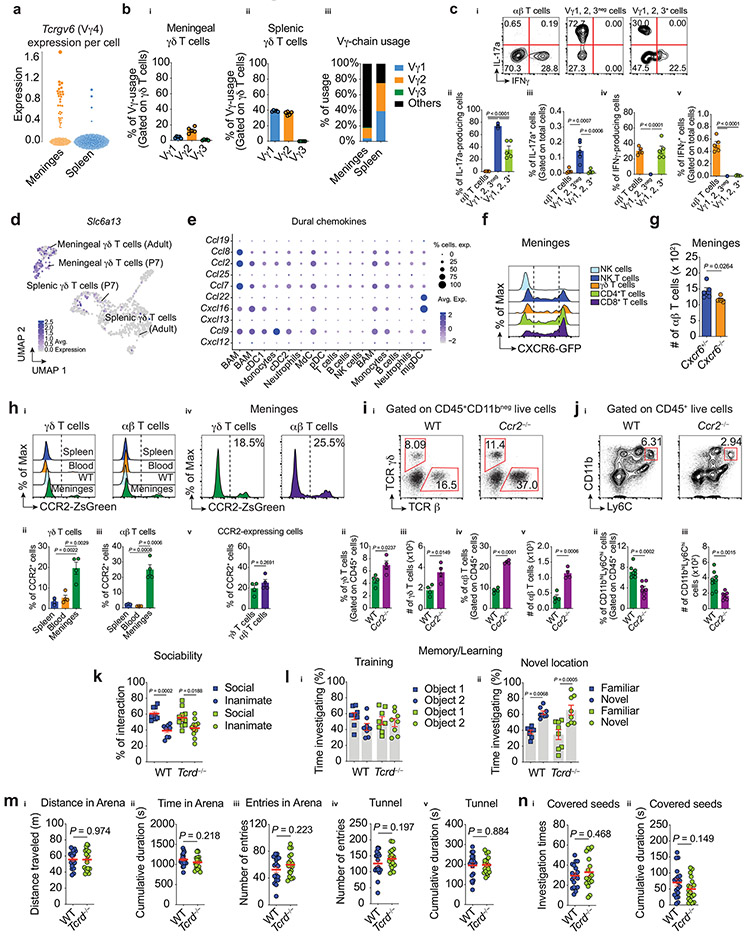
Extended Data Fig. 2. Meningeal γδ T cells expression profile and additional behavior paradigms using γδ T cell-deficient mice.
a, Normalized expression of Tcrgv6 transcripts (Vγ4 chain, Garman nomenclature) in meningeal and splenic γδ T cells obtained by single cell RNA-Seq. b, Graph bars of the TCR Vγ-usage in γδ T cells. bi, Meningeal and bii, splenic γδ T cells. biii, Overview of Vγ-chain usage (Vγ1, Vγ2, Vγ3 or others (Vγ4 or Vγ5)). ci, Representative contour plots of the intracellular staining for IL-17a and IFNγ in αβ T cells (TCR β+NK1.1neg) and γδ T lymphocytes (Vγ1, Vγ2, Vγ3–negative or positive fractions) isolated from steady state meninges. cii-v, Graph bars of the percentage of IL-17a– or IFNγ– producing cells in these different meningeal T cell subsets. One-way ANOVA followed by Bonferroni's multiple comparisons test. d, UMAP projection of γδ T cells colored by the scaled expression of Slc6a13 (GAT2). e, Average expression of chemokines in CD45+ cells isolated from steady state dura mater obtained from public database1. f, Representative histogram of the expression of CXCR6-GFP in meningeal T cell subsets. g, Absolute numbers of conventional αβ T cells isolated from CXCR6–sufficient and –deficient mice. Unpaired two-tailed t test. Data represent one independent experiment. hi, Adult Ccr2CreERT2:Ai6 mice were injected daily with tamoxifen (i.p., 10 mg/kg) and three days later meninges, spleen and blood were harvested for FACS analysis. Representative histograms of CCR2-ZsGreen expression in γδ T cells and conventional αβ T lymphocytes by flow cytometry. hii, Graph bars of the percentage of γδ T cell– and hiii, αβ T cell– expressing CCR2-ZsGreen in spleen, blood and meninges. hiv, Histograms of the expression of CCR2-ZsGreen in meningeal γδ and αβ T lymphocytes. hv, Frequency of CCR2–expressing cells. One-way ANOVA followed by Bonferroni's multiple comparisons test. ii, Representative dot plots of the percentage of meningeal TCR γδ– and TCR β– expressing cells isolated from WT or Ccr2−/− (Ccr2RFP/ RFP) mice. iii, Percentage and iiii, absolute number of meningeal γδ T cells. iiv, Percentage and iv absolute number of meningeal αβ T cells. Unpaired two-tailed t test. ji, Dot plots of the frequency of inflammatory monocytes (CD11bhiLy6Chi) isolated from WT or CCR2-deficient mice. jii, Percentage and jiii, absolute number of meningeal inflammatory monocytes. Data are pooled from two independent experiments with similar results. Unpaired two-tailed t test. k, Social interaction of wild-type and Tcrd−/− mice was assessed in the three-chamber test and the percentage of time investigating either a mouse (social) or an object (inanimate) was calculated. WT (n = 9); Tcrd−/− (n = 11). Two-way ANOVA followed by Bonferroni's multiple comparisons test. li, For the spatial memory task, WT and γδ T cell-deficient mice were assessed in the training and lii, novel location tasks of the novel location recognition (NLR) test and the time spent with either a familiar or novel object was determined. WT (n = 8); Tcrd−/− (n = 8). Two-way ANOVA followed by Bonferroni's multiple comparisons test. m, Foraging behavior of wild-type and Tcrd−/− mice assessed in the exploratory and n, foraging phase of the foraging paradigm. Data is pooled from three independent cohorts. WT (n = 18); Tcrd−/− (n = 18); Unpaired two-tailed t test. Data are shown as mean ± s.e.m. and each dot symbol represents individual mouse.

