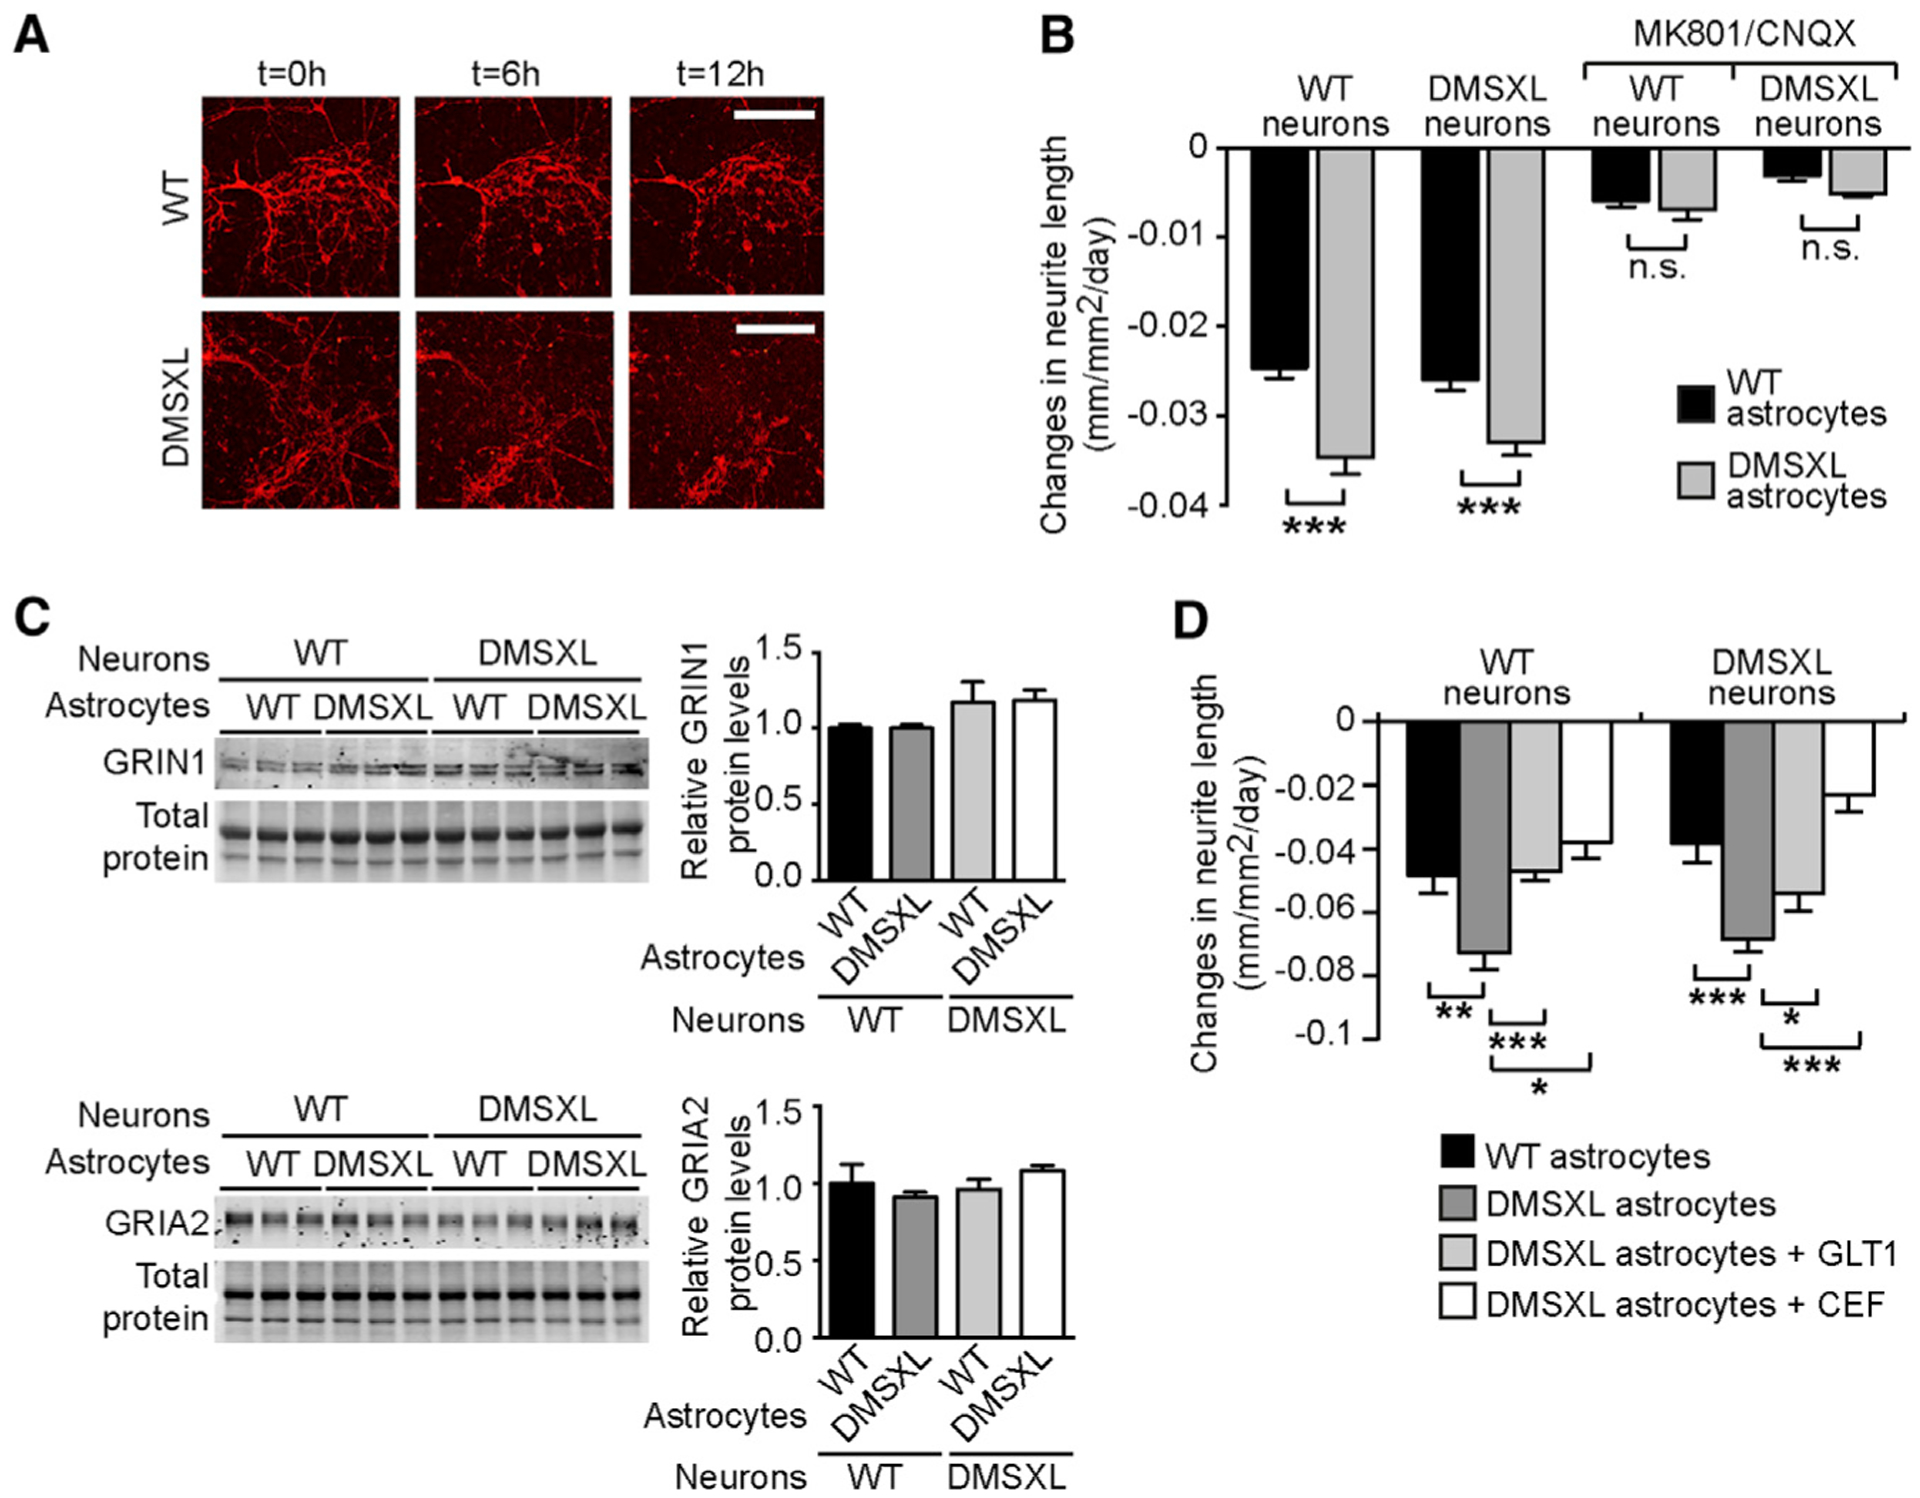
Figure 6. Neuronal Glutamate Toxicity in Mixed Cultures of Neurons and Astrocytes.

(A) Representative images of WT neurite collapse co-cultured with WT and DMSXL astrocytes. Glutamate (50 μM) was added to the medium at t = 0 hr, and neurite length was monitored by the expression of fluorescent red mKate2 protein under the control of the neuron-specific synapsin-1 promoter. The scale bar represents 200 μm.
(B) Rate of glutamate-induced neurite collapse of WT and DMSXL primary neurons, cultured with WT or DMSXL astrocytes. (+)-MK 801 (NMDA receptor antagonist) and CNQX (AMPA receptor antagonist) were added to block glutamate receptors (n = 4 independent co-cultures, each mixed genotype combination). The graph shows the quantification of three independent experiments (±SEM).
(C) Representative western blot of GRIN1 (NMDA receptor subunit) and GRIA2 (AMPA receptor subunit) in mixed neuroglial cultures (n = 3 independent mixed cultures). Data are represented as the mean (±SEM). Total protein was visualized by stain-free protocols and used as loading control.
(D) Rate of glutamate-induced neurite collapse of WT and DMSXL neurons. Mouse primary neurons were cultured with WT astrocytes, control DMSXL astrocytes, DMSXL astrocytes transfected with GLT1, or DMSXL astrocytes treated with 10 μM ceftriaxone (CEF) (n = 4 independent co-cultures, each combination).
Error bars represent the SEM. *p < 0.05, **p < 0.01, ***p < 0.001; one way-ANOVA; n.s., not statistically significant. See also Figure S6.
