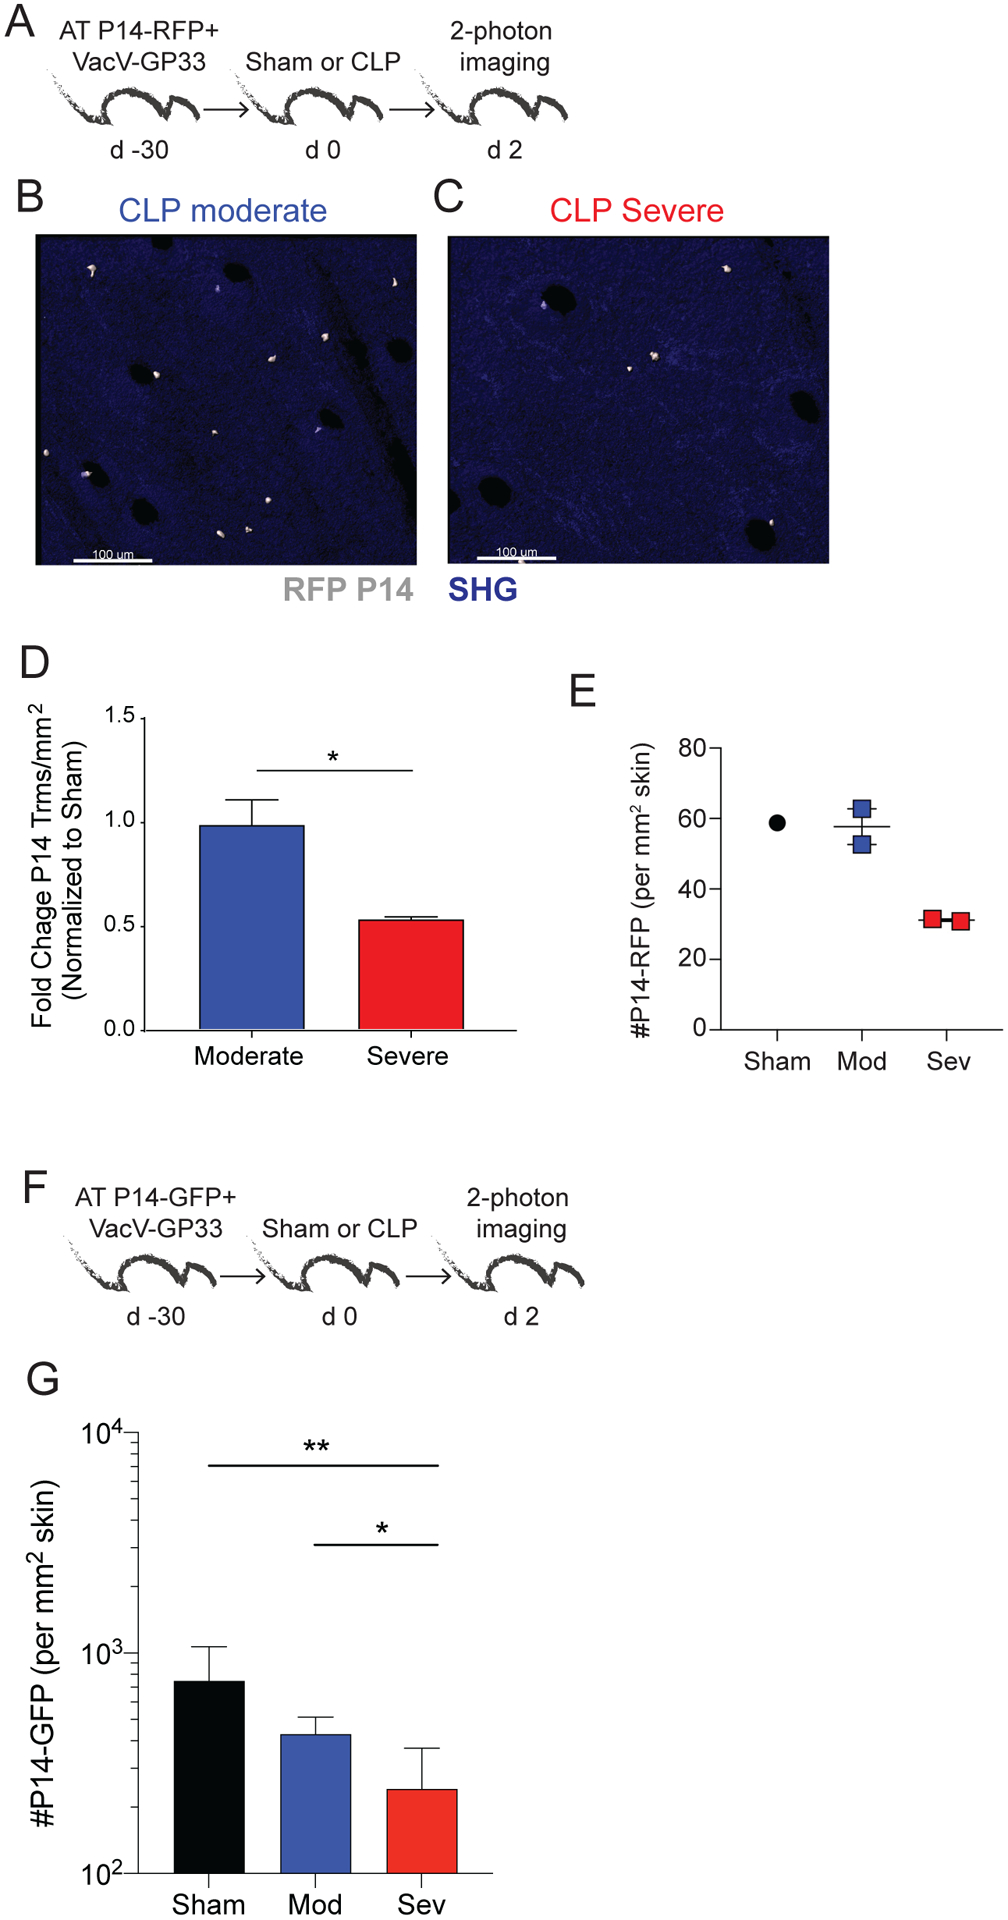
Figure 4. Visualizing the numerical decline skin CD8 TRM by in vivo imaging.

A) Experimental Design. Mice received 104 naïve P14-RFP CD8 T cells followed by VacV-GP33 infection in the ear. Immunized mice received sham or CLP surgery 30 days later. The number of P14-RFP CD8 T cells in the skin was quantified 2 days later using two-photon microscopy. Representative images of P14-RFP CD8 T cells (denoted with asterisk) in the skin of mice after B) CLP moderate and C) CLP severe surgery. D) Fold change of P14 CD8 TRM/mm2 in CLP moderate and severe mice normalized to sham mice 2 days after surgery. E) Number of P14-RFP CD8 T cells/mm2 of skin 2 days after surgery. F) Experimental Design. Mice received 5 × 10⁴ naïve P14-eGFP CD8 T cells followed by VacV-GP33 infection in the ear. Immunized mice received sham or CLP surgery 30 days later. The number of P14-eGFP CD8 T cells in the skin was quantified 2 days later using two-photon microscopy. G) Number of P14-eGFP CD8 T cells/mm2 of skin 2 days after surgery. Data in F-G are from a single experiment with 3–5 mice per group. * = p<0.05; ** = p<0.01; **** = p<0.0001 using two tailed students T-test or 1-way ANOVA corrected for multiple comparisons using Dunn’s test. Error bars represent the standard error of the mean.
