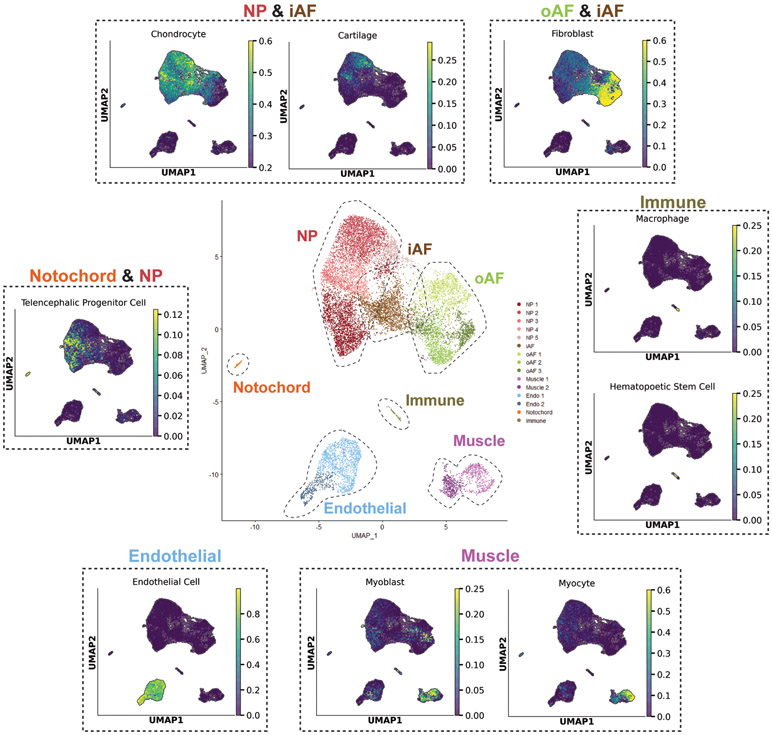
Figure 3: Custom unbiased cell population annotation pipeline corroborates supervised IVD partition annotations.
Center UMAP shows supervised annotations of scRNA-seq dataset. Surrounding UMAPs (dashed lines) were generated by unbiased cell population annotation tool. The unbiased cell population annotation tool annotates cells based on how closely their gene expression matches the gene profiles of annotated cells in published scRNA-seq datasets. UMAPs generated by the tool were organized based on which partition(s) they annotated. For example, many cells in the NP and iAF partitions were categorized as chondrocytes and cartilage using this tool. Scores range from 0 to 1, with higher scores indicating a greater likelihood of correctly annotating cells.

