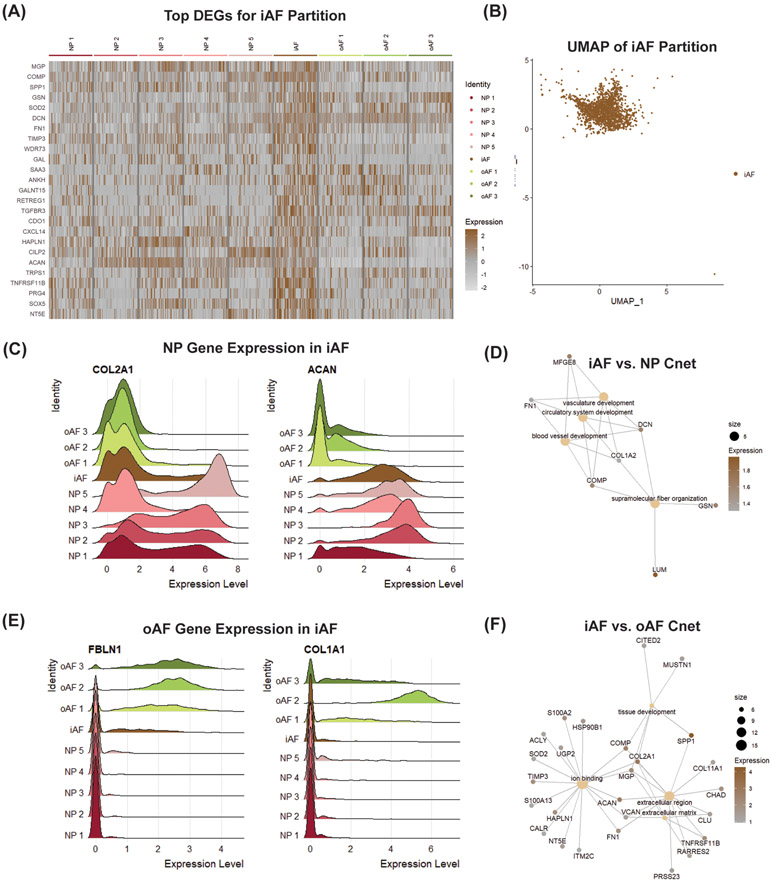
Figure 6: scRNA-seq analysis finds novel iAF cell marker genes.
(A) DEGA between iAF cluster and pooled NP and oAF partitions. (B) UMAP of iAF partition. Ridge plots showing overlapping gene expression of iAF cluster with (C) NP and (E) oAF partitions. Cnet plot displaying linkages of DEGs and associated biological processes between (D) iAF vs. NP and (F) iAF vs. oAF. Gene expression is the scaled expression value for the specified gene across individual cells.

