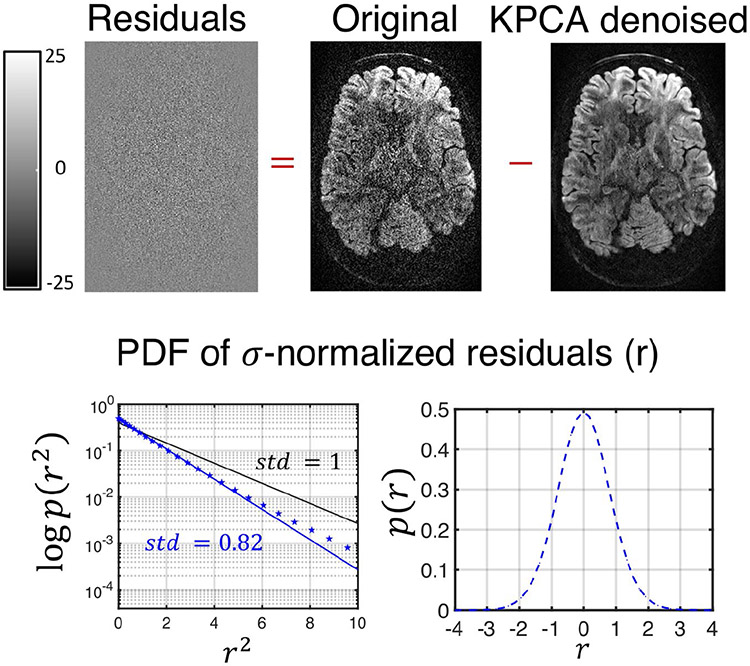
FIGURE 5.
Residual maps from the 660 μm resolution datasets after being denoised with KPCA. On top of the figure, the residual map from a given DW image, which shows no anatomical information. On the bottom, the probability density function of the residuals (r) normalized by the level of noise, σ. For the statistics, the normalized residuals are taken for all diffusion directions and number of repetitions. Note that the residuals for KPCA approximately follows a Gaussian distribution (blue dotted line on both plots representing the estimated pdf). On blue solid-line the optimal analytical zero-mean Gaussian distribution that best fits the data (maximum likelihood sense). Note that the standard deviation of the normalized residual, 0.82, is lower than 1 (black-line represents a zero-mean standard Gaussian distribution)

