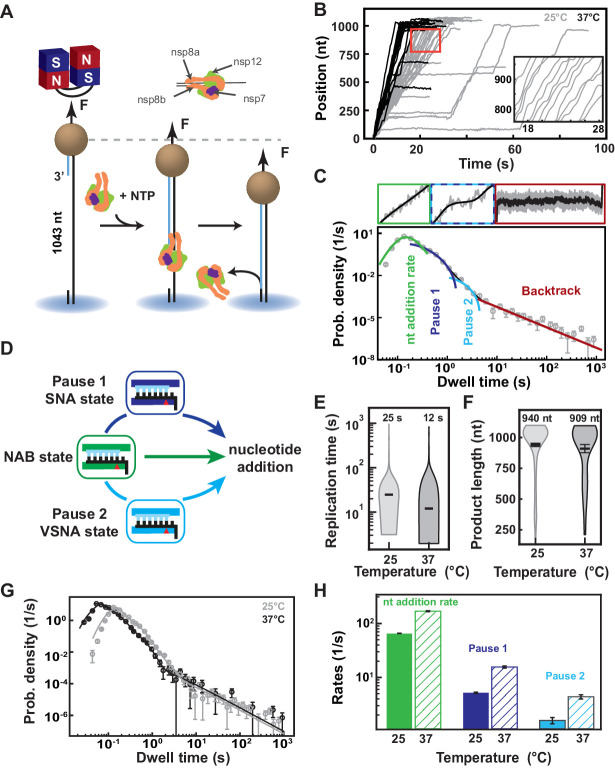
Figure 1. SARS-CoV-2 polymerase is a fast and processive RNA polymerase complex.
(A) Schematic of the magnetic tweezers assay to monitor RNA synthesis by the SARS-CoV-2 polymerase complex. A magnetic bead is attached to a glass coverslip surface by a 1043 long ssRNA construct that experiences a constant force F (35 pN if not mentioned otherwise). The polymerase, formed by nsp7, nsp8, and nsp12, assembles at the 3′-end of the RNA strand annealed to the template. The subsequent conversion of the ssRNA template into dsRNA reduces the end-to-end extension of the tether, signaling replication activity. (B) SARS-CoV-2 polymerase activity traces acquired at either 25°C (gray) or 37°C (black), showing bursts of nucleotide addition interrupted by pauses. The inset is a zoom-in of the traces captured in the red square. (C) The dwell times collected from (B) are assembled into a distribution that is fitted using a stochastic pausing model (see Materials and methods; solid lines). The model includes four different probability distribution functions that describe the event that kinetically dominates the dwell time: uninterrupted 10 nucleotide additions (green), exponentially distributed Pause 1 and Pause 2 (blue and cyan, respectively), and the power-law distributed backtrack (red). (D) The dwell time distribution in (C) is described by the viral RdRp kinetic model (adapted from Dulin et al., 2017). Fast nucleotide addition is achieved by the nucleotide addition burst (NAB) pathway with the nucleotide addition rate extracted from (C). Pause 1 and Pause 2 are the kinetic signatures of the slow and very slow nucleotide addition (SNA and VSNA, respectively) pathways, the latter being likely related to nucleotide mismatch incorporation. (E) Total replication time and (F) product length of SARS-CoV-2 polymerase activity traces at either 25°C or 37°C. The median total replication time and the mean product length are indicated above the violin plots, and represented as thick horizontal lines. The error bars represent one standard deviation extracted from 1000 bootstraps. (G) Dwell time distributions of SARS-CoV-2 polymerase activity traces at 25°C (gray circles) and 37°C (black circles) extracted from (B), and their respective fit to the stochastic-pausing model (corresponding solid lines). (H) Nucleotide addition rate (green), Pause 1 (dark blue), and Pause 2 (cyan) exit rates at either 25°C or 37°C (solid and hatched bars, respectively) extracted from (G). The error bars in (C and G) represent one standard deviation extracted from 1000 bootstraps. The error bars in (H) are one standard deviation extracted from 100 bootstraps.
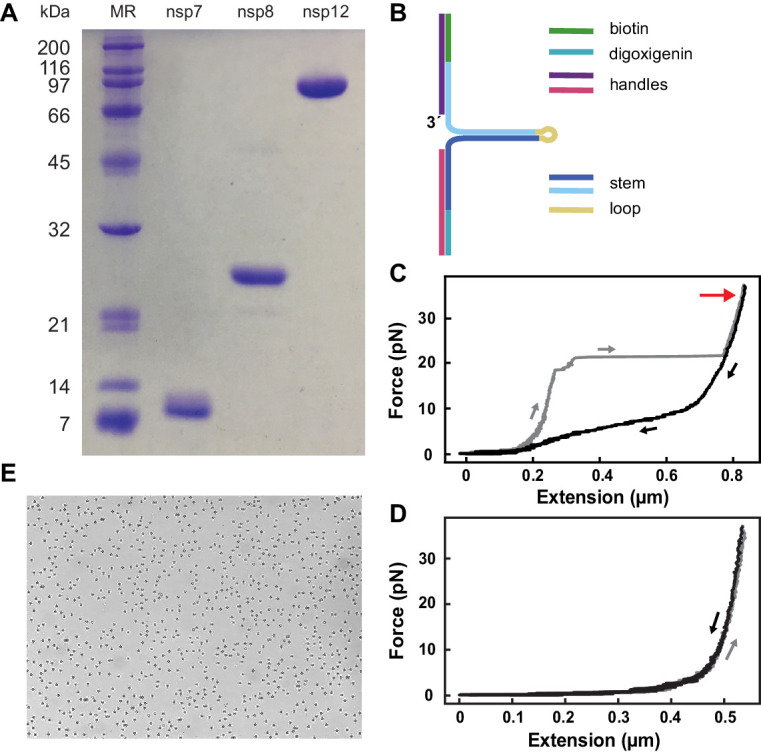
Figure 1—figure supplement 1. Experimental conditions of SARS-CoV-2 polymerase high throughput magnetic tweezers experiments.


