. 2021 Oct 7;10:e70968. doi: 10.7554/eLife.70968

Figure 6. ddhCTP and 3ʹ-dCTP inhibit efficiently the SARS-CoV-2 polymerase.

(A, B) SARS-CoV-2 polymerase activity traces for 500 µM NTPs and 500 µM of either (A) ddhCTP or (B) 3ʹ-dCTP. (C, D) SARS-CoV-2 polymerase product length using the indicated concentration of CTP, 500 µM of other NTPs, as a function of either (C) [ddhCTP]/[CTP] or (D) [3ʹ-dCTP]/[CTP]. The mean values are indicated above the violin plots, and represented by horizontal black thick lines flanked by one standard deviation error bars extracted from 1000 bootstraps. (E, F) SARS-CoV-2 polymerase activity traces in the presence of 50 µM of CTP, 500 µM of all other NTPs, and 500 µM of either (E) ddhCTP or (F) 3ʹ-dCTP. (G, H) SARS-CoV-2 polymerase activity traces product length using 50 µM CTP, 500 µM of other NTPs, as a function of the stoichiometry of either (G) [ddhCTP]/[CTP] or (H) [3ʹ-dCTP]/[CTP]. The mean values are indicated above the violin plots, and represented by horizontal black thick lines flanked by one standard deviation error bars extracted from 1000 bootstraps. In (C, D, G, H), the solid lines are the fits of the terminator effective incorporation rate (see Materials and methods). In (A, B, E, F), the insets are a zoom-in of the replication traces captured in the black square.

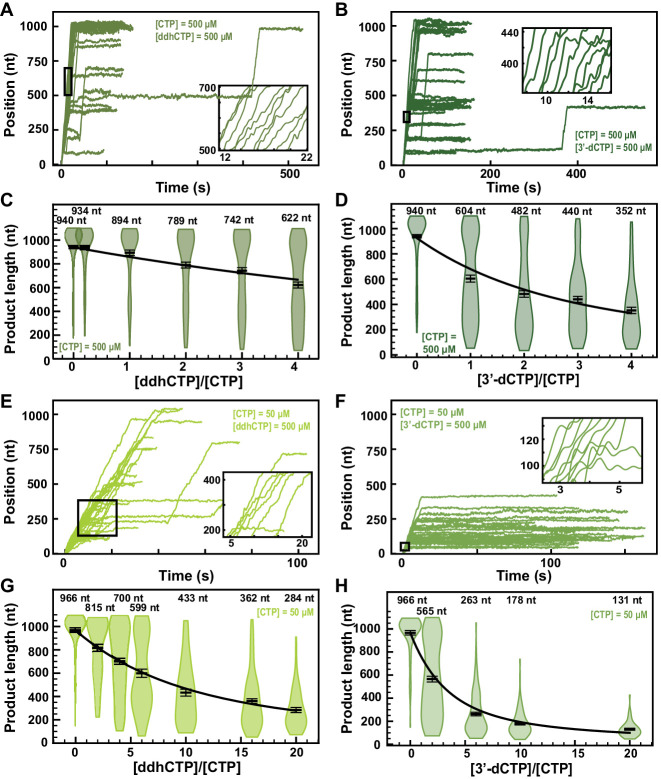
Figure 6.

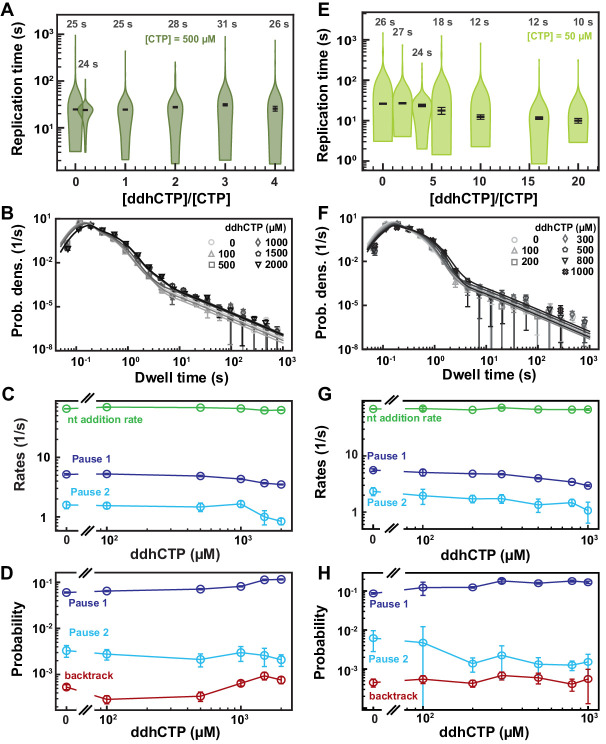
Figure 6—figure supplement 1. SARS-CoV-2 polymerase activity traces in presence of ddhCTP.

Figure 6—figure supplement 1.

(A, E) SARS-CoV-2 replication time for the 1043 nt long template using the indicated concentration of CTP, 500 µM of other NTPs, and the indicated stoichiometry of [ddhCTP]/[CTP]. The median values are indicated above the violin plots, and represented by horizontal black thick lines flanked by one standard deviation extracted from 1000 bootstraps. (B) Dwell time distributions of SARS-CoV-2 polymerase activity traces acquired in the presence of 500 µM NTP either without (circles) or with 0.1 mM (triangles), 0.5 mM (squares), and 1 mM (diamonds) ddhCTP. The color code from light to dark gray further highlights the increasing concentration of ddhCTP. The solid lines represent the fit to the stochastic-pausing model. (C) Nucleotide addition rate (green), Pause 1 (dark blue), and Pause 2 (cyan) exit rates for the conditions described in (B). (D) Probabilities to enter Pause 1 (dark blue), Pause 2 (cyan), and the backtrack (red) states for the conditions described in (B). (F) Dwell time distributions of SARS-CoV-2 polymerase activity traces acquired in the presence of 50 µM CTP, 500 µM of other NTPs, and either without (circles), or with 0.1 mM (triangles), 0.2 mM (squares), 0.3 mM (diamonds), 0.5 mM (pentagons), 0.8 mM (upside down triangle), and 1 mM (x) ddhCTP. The color code from light to dark gray further highlights the increasing concentration of ddhCTP. The solid lines represent the fit to the stochastic-pausing model. (G) Nucleotide addition rate (green), Pause 1 (dark blue), and Pause 2 (cyan) exit rates for the conditions described in (F). (H) Probabilities to enter Pause 1 (dark blue), Pause 2 (cyan), and the backtrack (red) states for the conditions described in (F). The error bars in (B, F) represent one standard deviation extracted from 1000 bootstraps and the error bars in (C, D, G, H) represent one standard deviation extracted from 100 bootstraps.
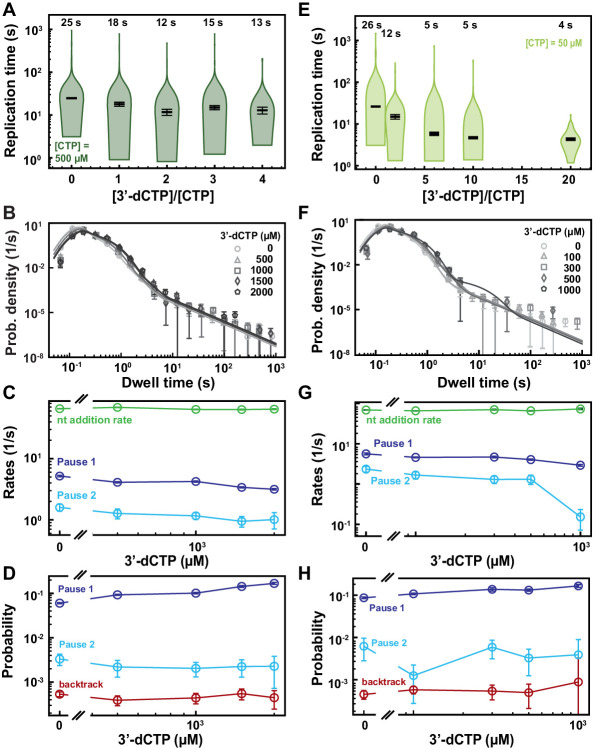
Figure 6—figure supplement 2. SARS-CoV-2 polymerase activity traces kinetics in presence of 3′-dCTP.

Figure 6—figure supplement 2.

(A, E) SARS-CoV-2 replication time for the 1043 nt long template using the indicated concentration of CTP, 500 µM of other NTPs as a function of the stoichiometry of [3′-dCTP]/[CTP]. The median values are indicated above the violin plots, and represented by horizontal black thick lines flanked by one standard deviation extracted from 1000 bootstraps. (B) Dwell time distributions of SARS-CoV-2 polymerase activity traces acquired in the presence of 500 µM NTP either without (circles) or with 0.5 mM (triangles), 1 mM (squares), 1.5 mM (diamonds), and 2 mM (pentagon) 3′-dCTP. The color code from light to dark gray further highlights the increasing concentration of 3′-dCTP. The solid lines represent the fit to the stochastic-pausing model. (C) Nucleotide addition rate (green), Pause 1 (dark blue), and Pause 2 (cyan) exit rates for the conditions described in (B). (D) Probabilities to enter Pause 1 (dark blue), Pause 2 (cyan), and the backtrack (red) states for the conditions described in (B). (F) Dwell time distributions of SARS-CoV-2 polymerase activity traces acquired in the presence of 50 µM CTP, 500 µM of other NTPs, and either without (circles), or with 0.1 mM (triangles), 0.3 mM (squares), 0.5 mM (diamonds), and 1 mM (pentagons) 3′-dCTP. The color code from light to dark gray further highlights the increasing concentration of 3′-dCTP. The solid lines represent the fit to the stochastic-pausingmodel. (G) Nucleotide addition rate (green), Pause 1 (dark blue), and Pause 2 (cyan) exit rates for the conditions described in (F). (H) Probabilities to enter Pause 1 (dark blue), Pause 2 (cyan), and the backtrack (red) states for the conditions described in (F). The error bars in (B, F) represent one standard deviation extracted from 1000 bootstraps and the error bars in (C, D, G, H) represent one standard deviation extracted from 100 bootstraps.
Figure 6—figure supplement 3. ddhC does not inhibit SARS-CoV-2 replication in huh7-hACE2 cells.

Figure 6—figure supplement 3.

Huh7-hACE2 cells in 96-well were incubated with the indicated concentrations of the tested compounds for 1.5 hr before SARS-CoV-2 (USA-WA1/2020 isolate) was added at MOI of 0.05. At ~24 hpi, the percentage of infected cells was assessed by immunofluorescence assay using a rabbit monoclonal antibody against the SARS-CoV-2 N protein. ‘sofo’ is Sofosbuvir. Results in (A and B) represent two separate experiments.
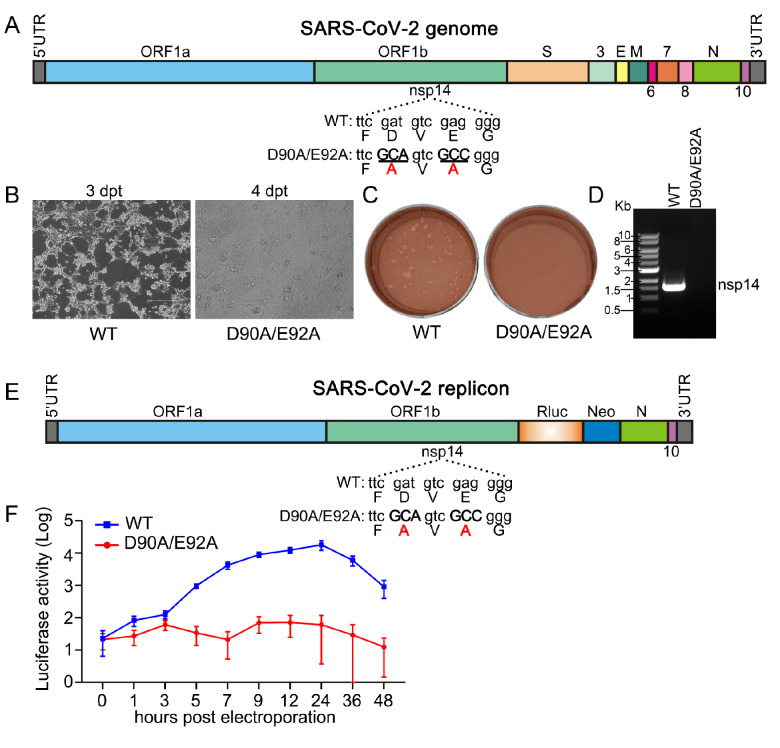
Figure 6—figure supplement 4. SARS-CoV-2 nsp14 exoribonuclease knockout is not replicative.

Figure 6—figure supplement 4.

(A) SARS-CoV-2 genome. The SARS-CoV-2 nsp14 exoribonuclease nucleotides and amino acid mutations (D90A/E92A) are indicated. (B) Phase-contrast images of electroporated cells. Vero E6 cells were electroporated with SARS-CoV-2 WT or nsp14 exoribonuclease knockout mutant RNA. (C) Plaque morphology of SARS-CoV-2 WT and nsp14 exoribonuclease knockout mutant viruses. Supernatants were harvested on day 3 post-electroporation (WT) and day 4 post-electroporation (mutant) from (B). Plaque assay was performed in Vero E6 cells and staining with neutral red solution after 48 hr infection. (D) RT-PCR analysis. Extracellular RNA from (B) were harvested on day 3 (WT) and day 4 (mutant). The nsp14 region of SARS-CoV-2 was amplified by RT-PCR to confirm viral production. Figure 6—figure supplement 4—source data 1 is the original of the agarose gel. (E) Transient replicon of SARS-CoV-2. A Renilla luciferase gene is inserted as a reporter and the nsp14 exoribonuclease knockout is shown as indicated. (F) Replicon luciferase assay. Huh-7 cells were electroporated with WT or mutant replicon RNA, cells were harvested and assayed for luciferase activities at indicated timepoints.
Figure 6—figure supplement 4—source data 1. Source image for the agarose gel in Figure 6—figure supplement 4D.