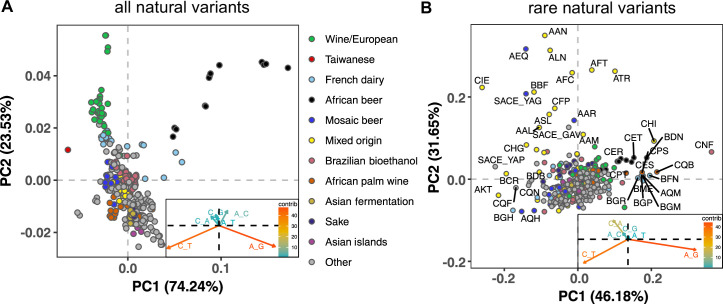
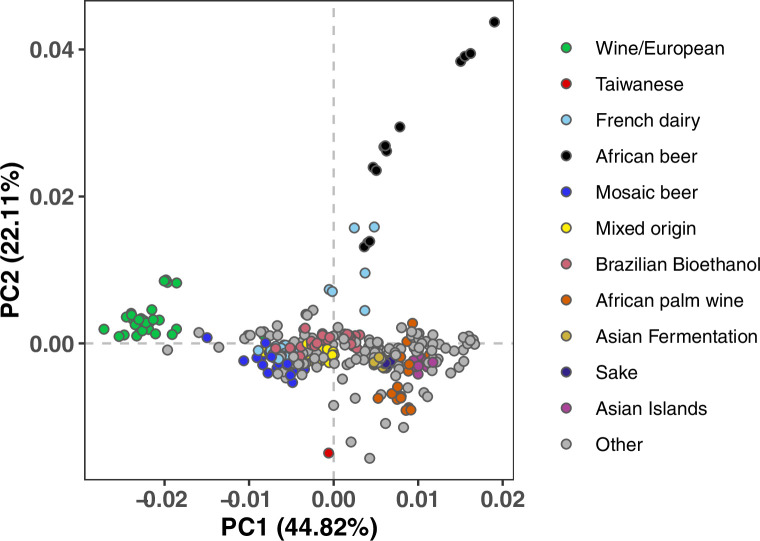
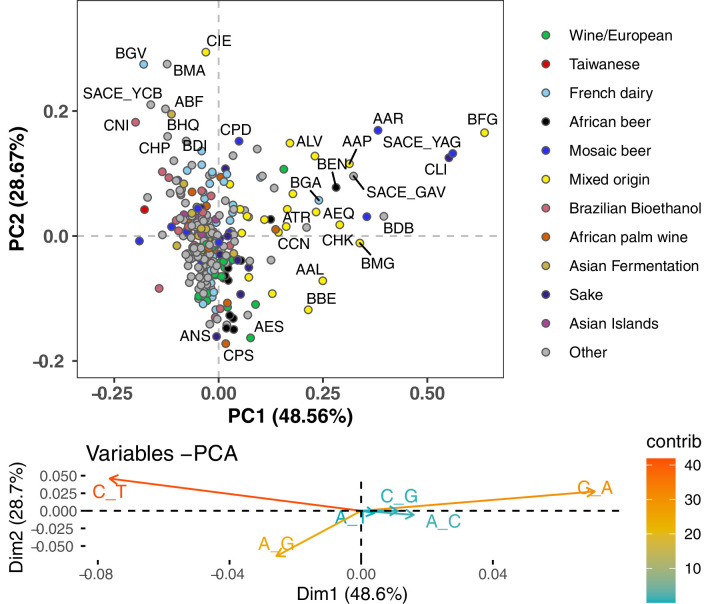
Figure 1. Mutation spectra of natural isolates of S. Cerevisiae.
Principal component analysis of segregating mutation spectrum variation from a subset of the 1011 yeast strains. (A). Mutation spectrum PCA of all natural variants under 50% derived allele frequency. Each strain’s mutation spectrum histogram is projected as a single point, colored to indicate its population of origin (Peter et al., 2018). The inset summarizes the loadings of the first and second principal component vectors. (B). Mutation spectrum PCA of rare variants (derived allele count 2–4). Singleton variants are excluded to minimize the impact of sequencing error. Strains appearing more than 1.8 standard deviations from the origin along both PC1 and PC2 are labeled with their strain names.
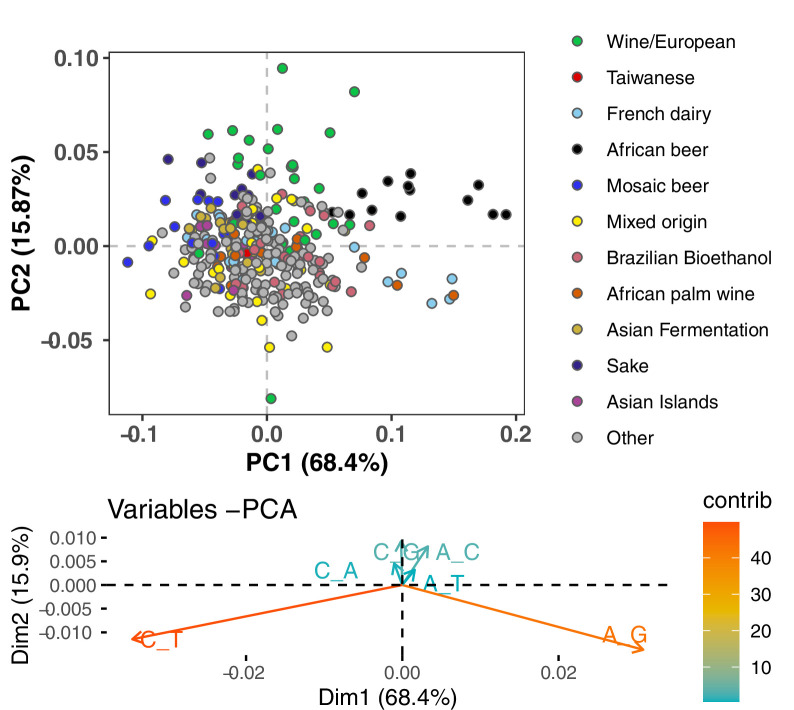
Figure 1—figure supplement 1. Mutation spectrum PCA after subsampling to avoid overlap between lineages.
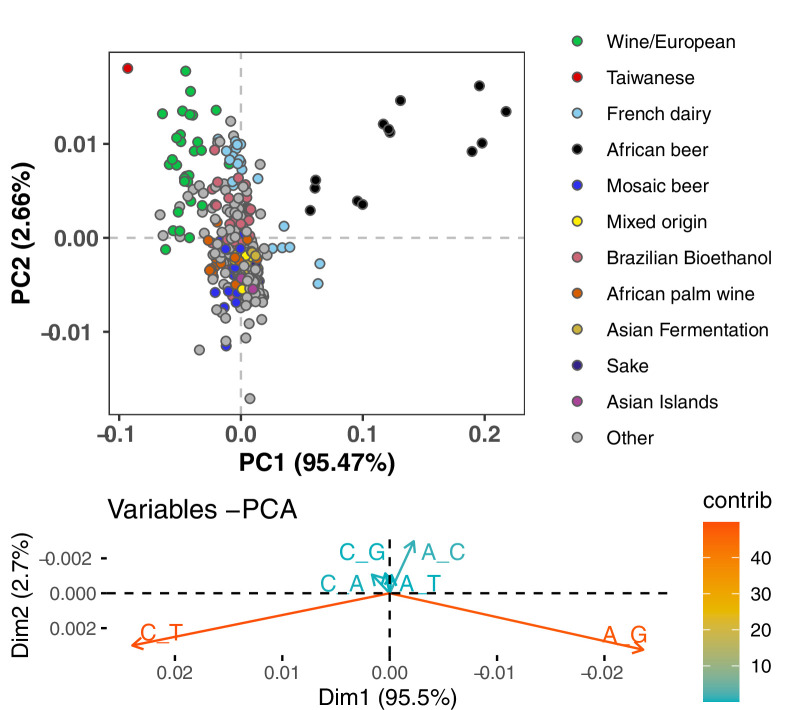
Figure 1—figure supplement 2. PCA of synonymous variant mutation spectra.
Figure 1—figure supplement 3. Mutation PCA using all variants stratified by triplet context.
Figure 1—figure supplement 4. PCA of singleton mutation spectra.
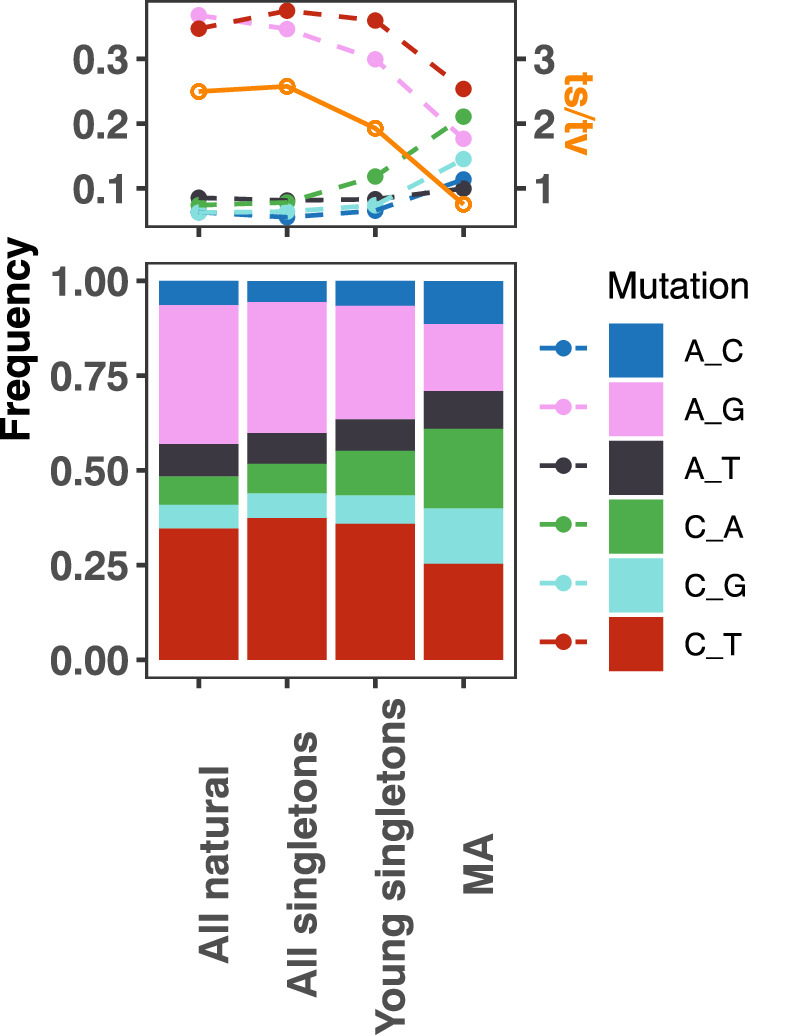
Figure 1—figure supplement 5. Mutation spectrum comparison of natural variants versus de novo mutations from a previous mutation accumulation (MA) study.
