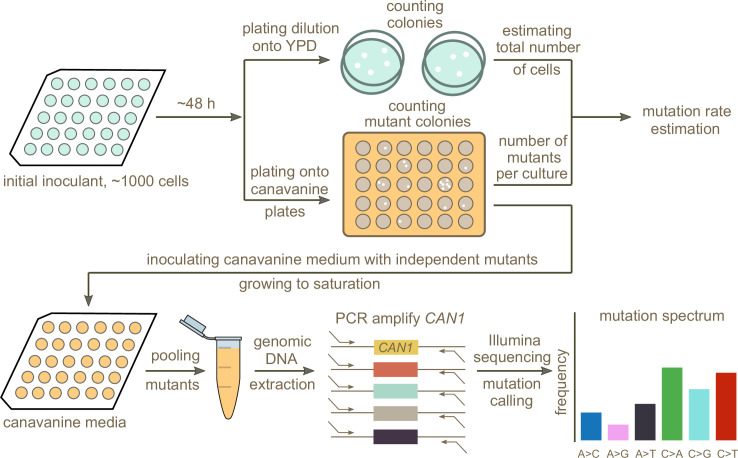
Figure 2. Schematic overview of the experimental pipeline.
Overview of the experimental pipeline used to estimate the mutation rate and spectrum for each strain using the reporter gene CAN1. First, mutation rates were estimated using fluctuation assays. Independent mutants were then pooled and sequenced to estimate the mutation spectrum of each strain.

