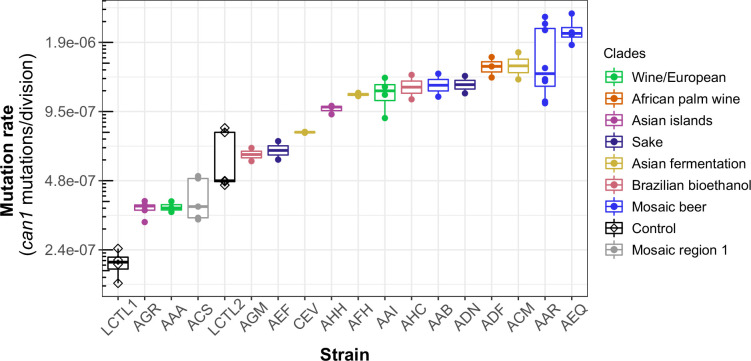
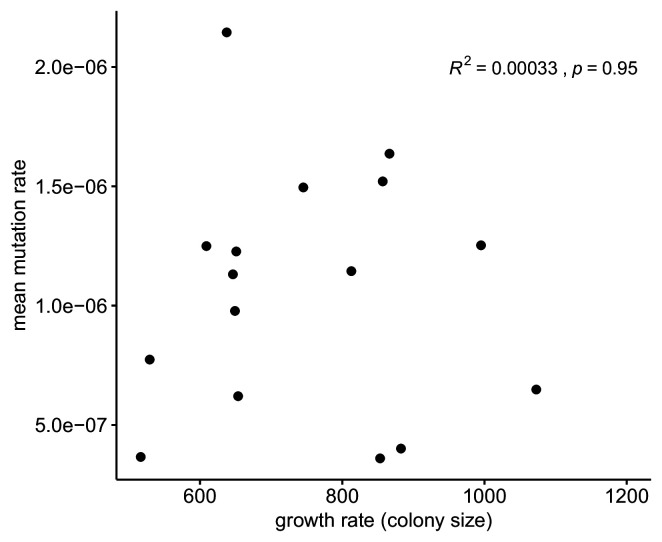
Figure 3. Haploid natural isolates exhibit a 10-fold range of mutation rate variation.
Mutation rate variation measured among haploid natural isolates using our CAN1 reporter gene Luria-Delbrück fluctuation assays. Strains are shown ordered by their mean mutation rates. Mutation rates for each strain were estimated using at least two replicates, each estimate represented here by a dot. A standard boxplot spans the interquartile confidence interval of possible mutation rates for each strain.


