. 2021 Sep 15;10:e68285. doi: 10.7554/eLife.68285

Figure 4. De novo mutation rates and spectra in natural isolates.

(A). Single nucleotide mutation rates plotted against MNM rates across strains. These rates were calculated by multiplying the mean mutation rate estimated using CAN1 by the proportion of mutations in each strain measured to be either single-nucleotide mutations or MNMs. Here, single nucleotide mutations include both single base pair substitutions and indels. (B). Mutation spectra in AEQ and AAR show significant enrichment of C > A mutations compared to the control lab strain LCTL1. Only single base-pair indels were used to generate these counts. (C). A PCA of the same strains’ de novo mutation spectra compared to the mutation spectrum reported in Lang and Murray, 2008.

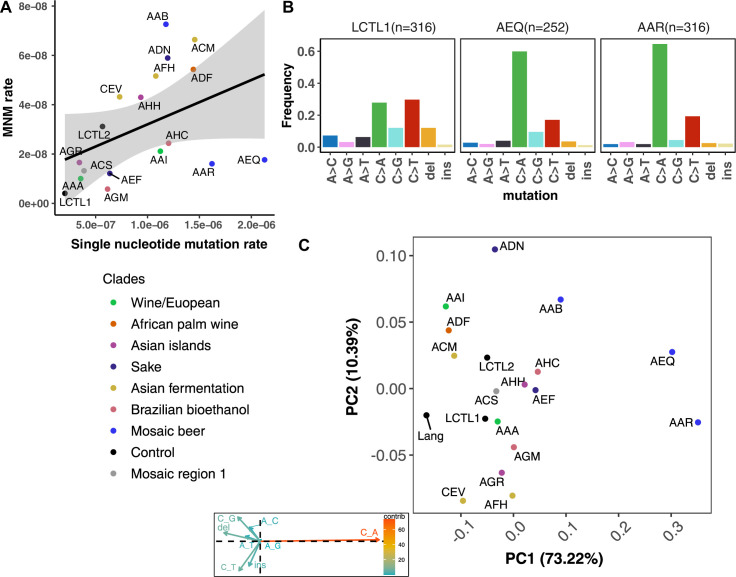
Figure 4.

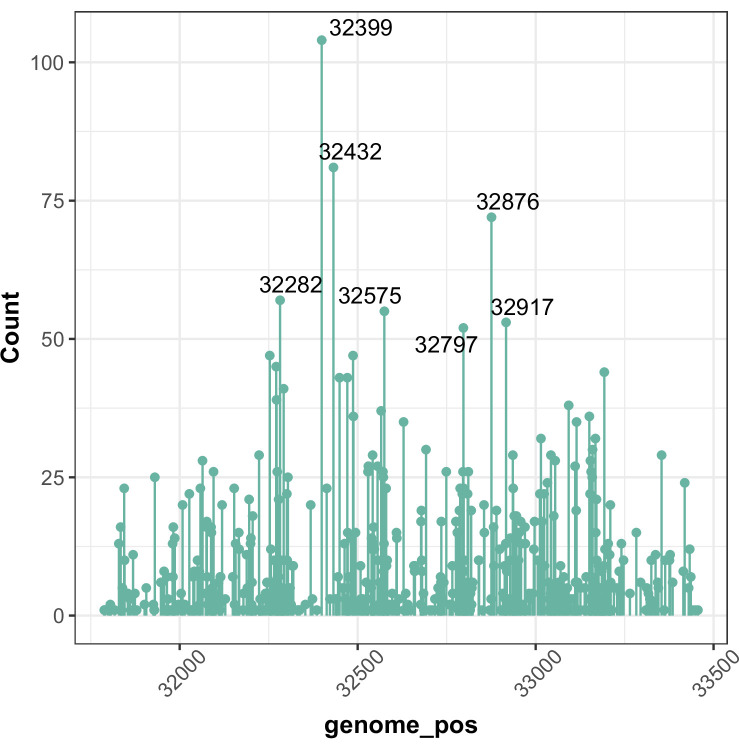
Figure 4—figure supplement 1. Hotspots of CAN1 mutation across different strain backgrounds (chr V).

Figure 4—figure supplement 1.

Here, we plot the number of mutations observed at each genomic position across all fluctuation assays combined. Hotspots where 50 or more mutations were observed are labeled with their genomic positions.
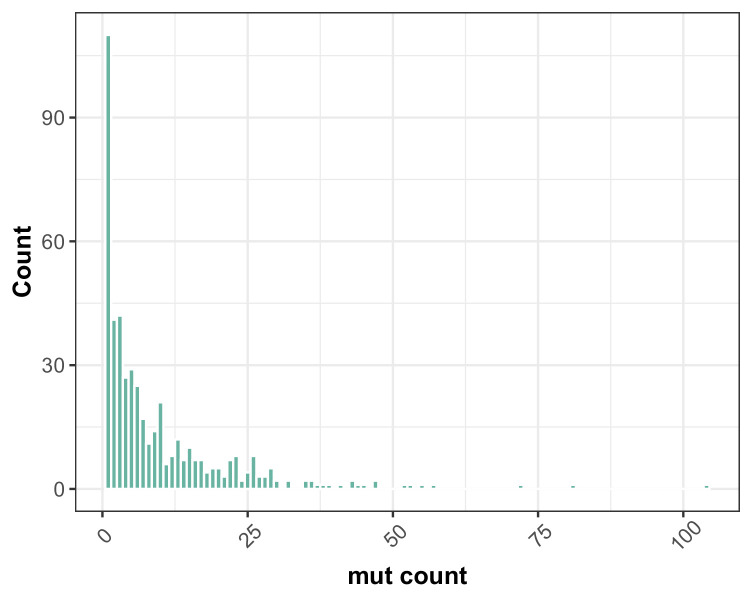
Figure 4—figure supplement 2. Distribution of multiplicity of mutations observed at each mutated site in CAN1.

Figure 4—figure supplement 2.

As summarized in this frequency spectrum, a plurality of mutations were observed just once, but some sites appear to be mutation hotspots that were found to be mutated in 50 or more independent fluctuation assays.
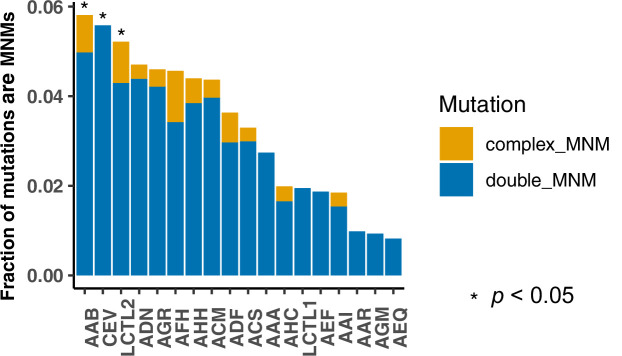
Figure 4—figure supplement 3. Fraction of multinucleotide mutations (MNMs) in each strain.

Figure 4—figure supplement 3.

A Chi-square test was performed on each strain to compare its ratio of MNM counts to single mutation counts to the ratio observed in the standard reference LCTL1 strain. Asterisks denote strains with significantly elevated MNM-to-SNP ratios (p < 0.05).
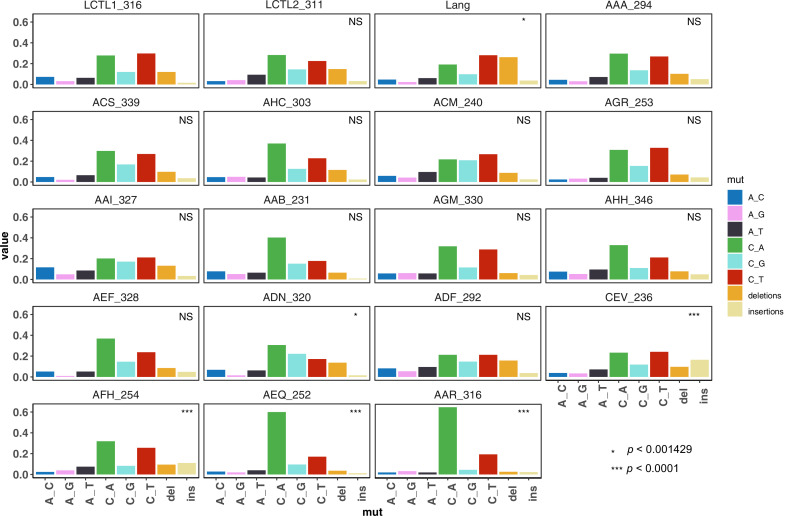
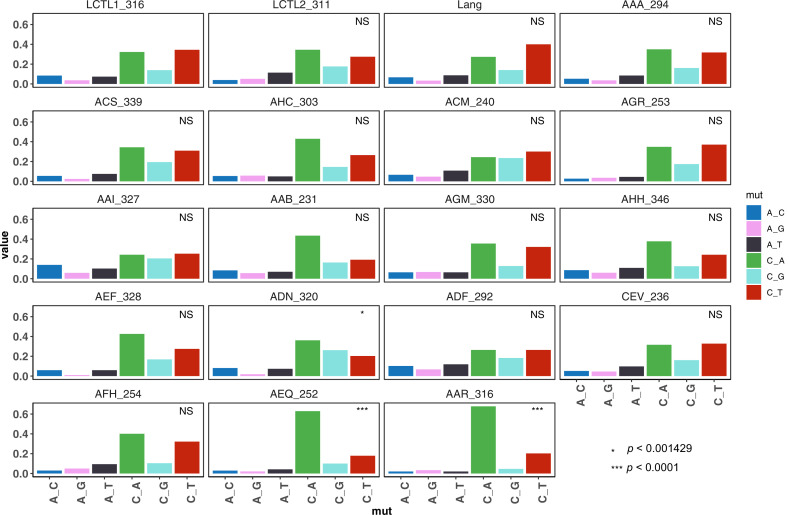
Figure 4—figure supplement 4. De novo mutation spectra of all strains (single base-pair substitutions and single base-pair indels).

Figure 4—figure supplement 4.

Each strain is marked by the strain name followed by the total number of mutants collected from that strain. We used a hypergeometric test to compare the mutation spectrum of each strain to that of the control LCTL1 strain, and those which differ significantly after Bonferoni correction are marked with asterisks.
Figure 4—figure supplement 5. De novo mutation spectra of all strains (single base-pair substitutions only).

Figure 4—figure supplement 5.

We used a hypergeometric test to compare each strain to the control LCTL1 strain, and those which differ significantly after Bonferoni correction are marked with asterisks.
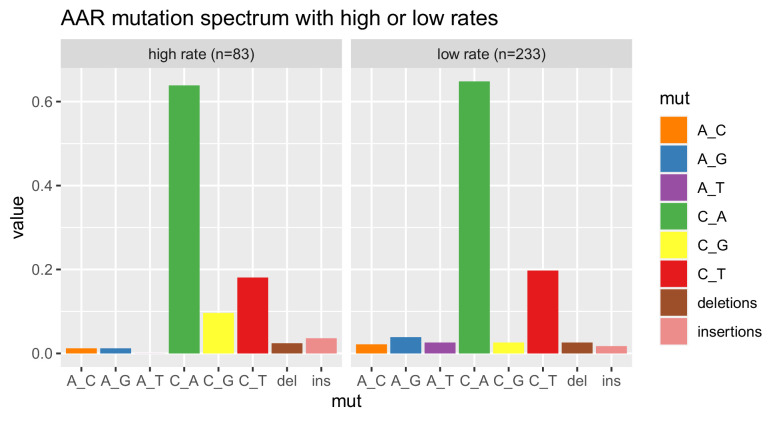
Figure 4—figure supplement 6. Comparison of AAR mutation spectra from high versus low mutation rate batches.

Figure 4—figure supplement 6.

As shown in Figure 3, we measured a bimodal distribution of mutation rates in the strain AAR. To investigate whether AAR pools with different measured mutation rates also have different mutation spectra, we classified each replicate as a high-rate or low-rate replicate based on whether the rate from the replicate was greater or less than 1.9e-6, then computed the mutation spectrum of each rate bin. The two spectra both exhibit the strain’s distinctive enrichment of C > A mutations.
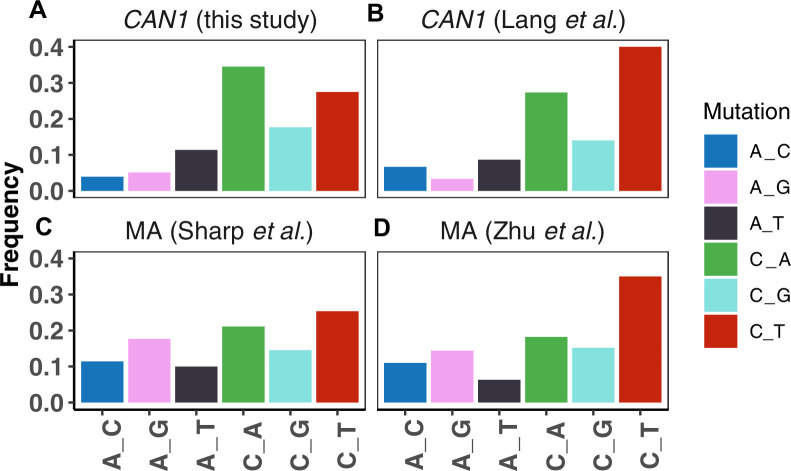
Figure 4—figure supplement 7. Comparison of mutation spectra from CAN1 reporter assays versus whole genome mutation accumulation (MA).

Figure 4—figure supplement 7.

A. The CAN1 mutation spectrum from the strain LCTL2 measured in this study (the same strain was previously used in Lang and Murray, 2008). B. The CAN1 mutation spectrum of LCTL2 previously reported in Lang and Murray, 2008 C. A whole genome mutation spectrum from an MA study by Sharp et al., 2018, using haploid yeast from the RDH54+ strain. D. A whole-genome mutation spectrum of diploid MA study by Zhu et al., 2014.