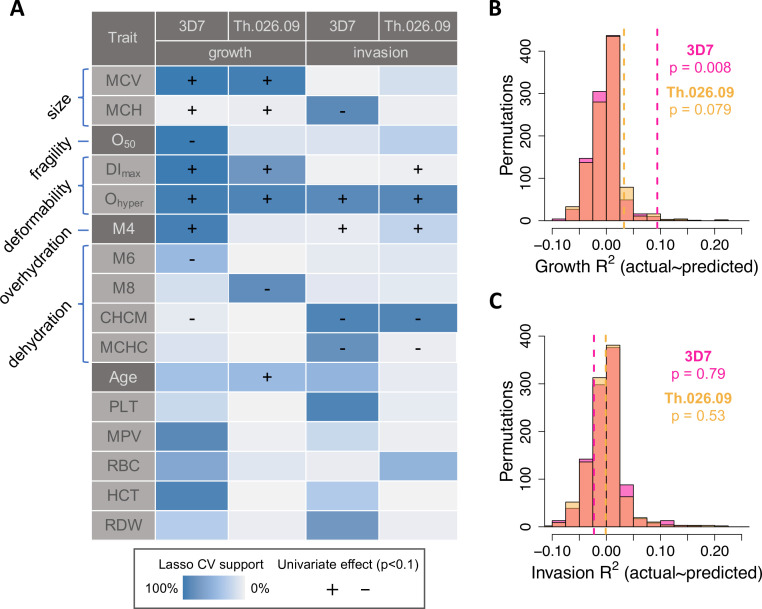
Figure 4. RBC phenotypes predict Plasmodium falciparum fitness in non-carriers.
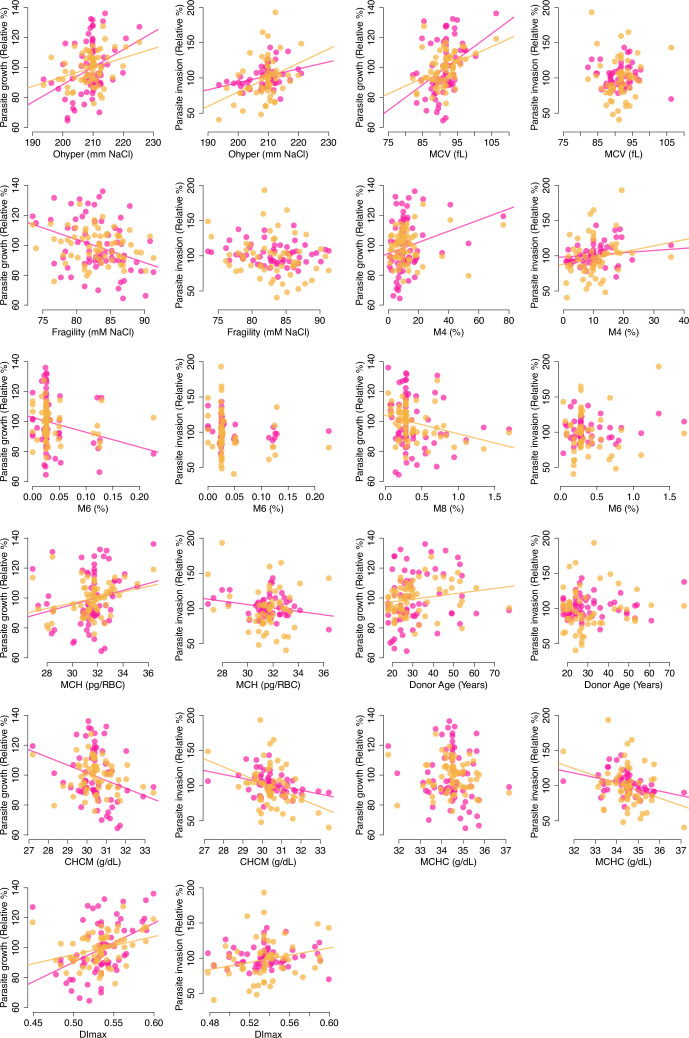
(A) Phenotypes selected by LASSO in at least 40% of train data sets (blue shading; see Materials and methods) in at least one of four models of parasite replication (columns). Each model was trained on ~90% of the data (B, C) and tested on the remaining 10% (B, C). (+/−) shows the direction of effect if the phenotype was significantly correlated (p<0.1) with the parasite fitness component in a separate, univariate linear model (Figure 4—figure supplement 1; ). MCV: mean RBC volume (fl).MCH: mean corpuscular hemoglobin (pg/RBC). O50: Osmotic fragility (mM NaCl; see Figure 3—figure supplement 4). DImax: Maximum membrane deformability (arbitrary units; see Figure 3—figure supplement 5). Ohyper: Tendency to resist osmotic dehydration and loss of deformability. M4: fraction of RBCs with normal volume and low hemoglobin (see Figure 3—figure supplement 2). M6: fraction of RBCs with normal volume and high hemoglobin. M8: fraction of RBCs with low volume and normal hemoglobin. CHCM: cellular hemoglobin concentration mean (g/dl). MCHC: mean corpuscular hemoglobin concentration (g/dl). PLT: platelet number (×103/µl). MPV: mean platelet volume (fl). RBC: red cell number (×106/µl). HCT: hematocrit, or the fraction of blood volume composed of RBCs. RDW: red cell distribution width (%). (B, C) Variance in parasite fitness explained by RBC phenotypes in LASSO models. Dashed lines indicate average R2 for the measured test data. Each histogram shows the same procedure on 1000 permutations of the measured test data. RBC, red blood cell.


