. 2021 Sep 23;10:e69808. doi: 10.7554/eLife.69808

Figure 5. Common variation in malaria-associated genes predicts Plasmodium falciparum fitness in non-carrier RBCs.

(A) Variants in 23 malaria-related genes (Figure 5—source data 1) and genetic PCs selected by LASSO in at least >40% of train data sets. Each model was trained on ~90% of the measured data (B C) and tested on the remaining 10% (B C). The following genes had no associated variants in non-carriers: CD55, EPB41, FPN, G6PD, GYPA, GYPE, HBA1/2, HBB, and HP. *The only significant PC association was driven by a single East Asian donor (Figure 5—figure supplement 5). (B, C) Variance in parasite fitness explained by LASSO models including 23 malaria-related genes, the top 10 PCs, and RBC phenotypes. Dashed lines indicate average R2 for models using the measured test data. Each histogram shows R2 for models including variants from 23 random genes in the RBC proteome (Figure 5—source data 2) instead of malaria-related genes. All predictors with non-zero LASSO support are shown in Figure 5—source data 3. Additional histograms from permuted data are shown in Figure 5—figure supplement 1. The variance explained by variants undiscovered by previous GWAS is shown in Figure 5—figure supplement 4. GWAS, genome-wide association studies; PC, principal component; RBC, red blood cell.

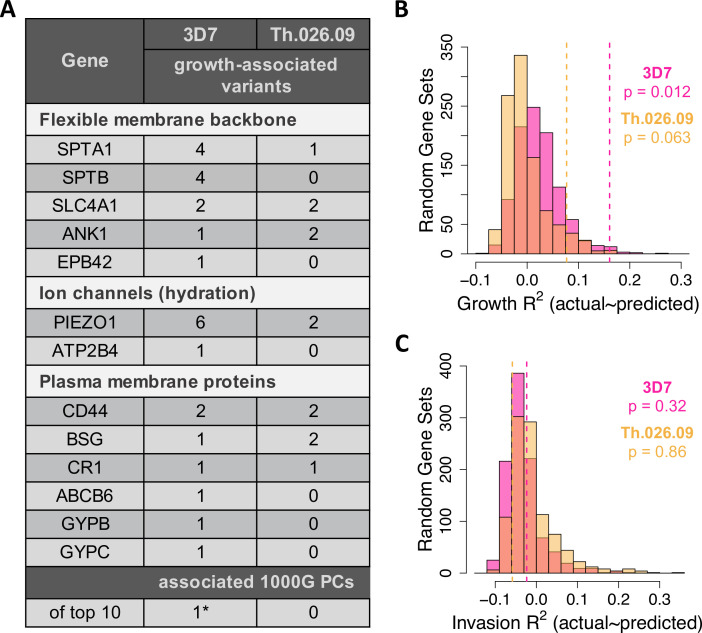
Figure 5—source data 1. Twenty-three RBC genes with strong links to malaria in the literature.
Figure 5—source data 2. Proteins present in mature RBCs.
This list was derived from the Red Blood Cell Collection database (rbcc.hegelab.org) using a medium-confidence filter.
Figure 5—source data 3. All genetic and phenotypic predictors with non-zero LASSO support.
Growth predictors selected in at least 40% of train data sets are indicated in bold. Genetic predictors are summarized in Figure 5A. NA indicates predictors that were only present as singletons in the smaller invasion data set.

Figure 5.

Figure 5—figure supplement 1. Variance in parasite fitness explained by permuted data in LASSO models.

Figure 5—figure supplement 1.

Each model was trained on ~90% of the measured data and tested on the remaining 10%. Dashed lines indicate average R2 for the measured test data. Each histogram shows the same procedure on 1,000 permutations of the measured test data.
Figure 5—figure supplement 2. Lack of association between RBC dehydration phenotypes and PIEZO1 rs59446030 or ATP2B4 rs1419114.

Figure 5—figure supplement 2.

Each cell shows the p-value from a linear model between the genetic variant and trait in non-carriers. RBC, red blood cell.
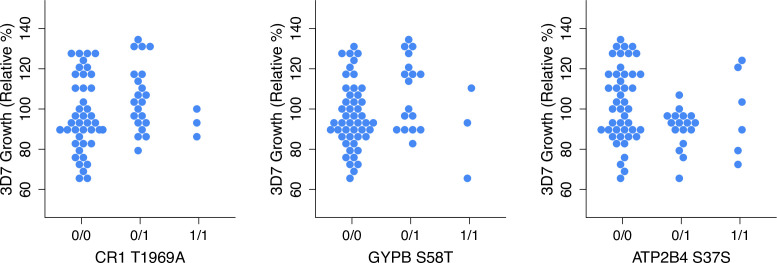
Figure 5—figure supplement 3. Three non-carrier variants with potentially overdominant effects on 3D7 growth.

Figure 5—figure supplement 3.

Homozygotes for the minor allele were ignored when estimating effect sizes for these alleles with OLS for Figure 6E. Effect size estimates that include all homozygotes are shown in Figure 5—source data 3.
Figure 5—figure supplement 4. Variants undiscovered by previous GWAS drive most of the association signal between parasite replication rate and the 23 malaria-related genes.

Figure 5—figure supplement 4.

‘Variance explained’ is the R2 of a linear model in non-carriers (excluding using only these variants as predictors. Details on the variants and previous GWAS traits are provided in Figure 5—source data 3). GWAS, genome-wide association studies.
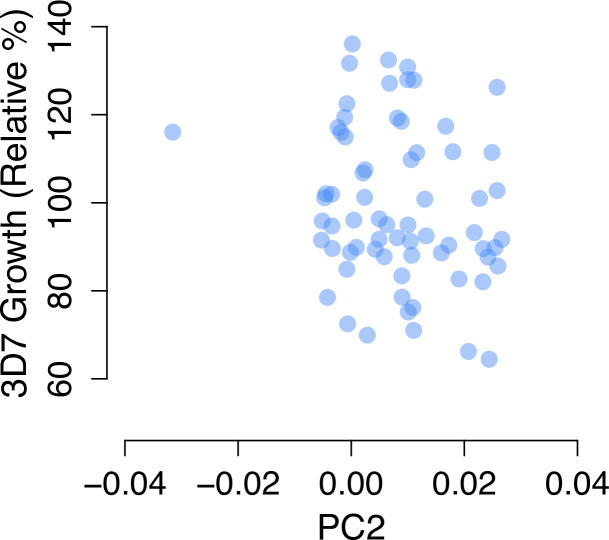
Figure 5—figure supplement 5. An outlier individual for PC2 drives an apparent association between PC2 and 3D7 growth.

Figure 5—figure supplement 5.

See also Figure 1A.
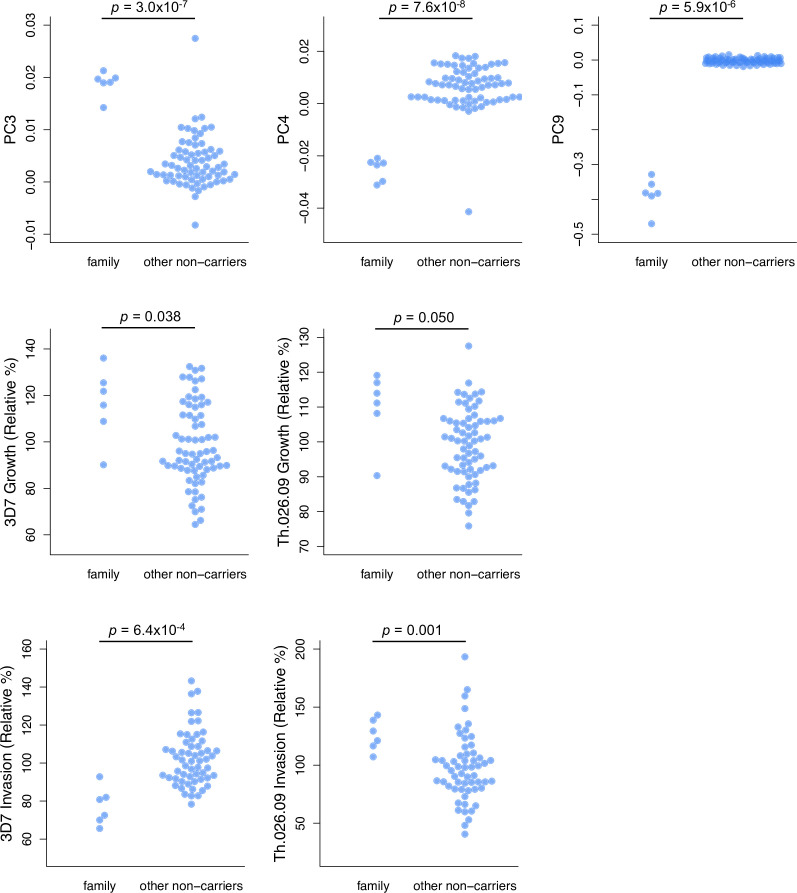
Figure 5—figure supplement 6. A six-member family has unique ancestry and parasite susceptibility compared to other non-carrier donors.

Figure 5—figure supplement 6.

Only PCs that distinguish the family from other non-carriers are shown. P-values are derived from t-tests. PC, principal component.