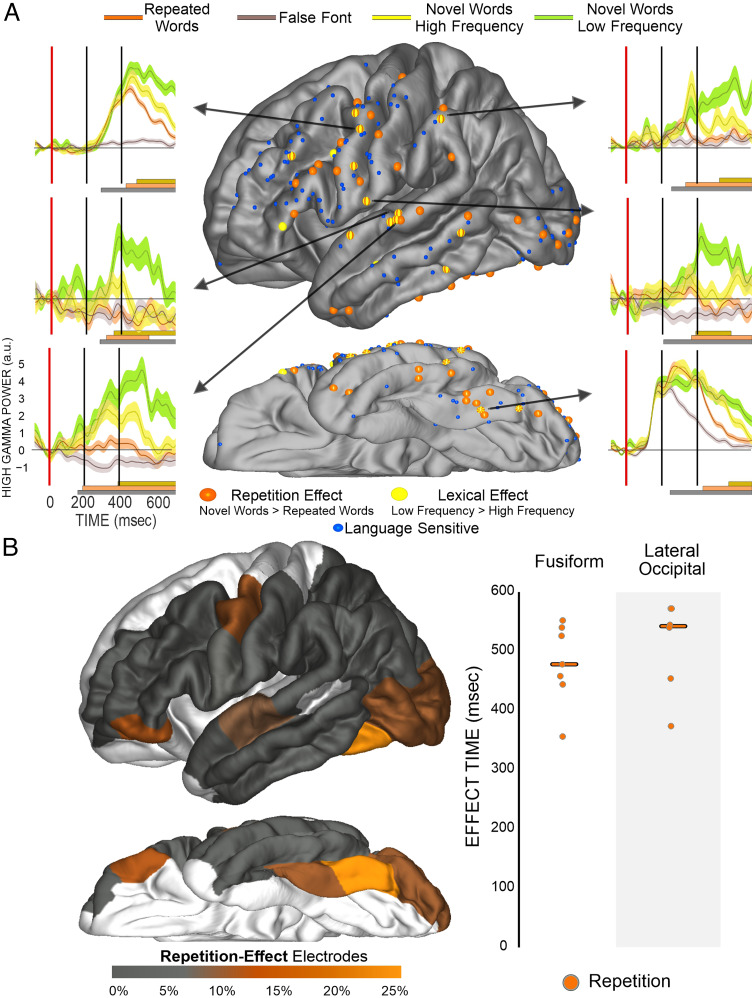
Figure 5. .
The distribution and timing of repetition and lexical-frequency effects. (A) Display of electrode location (approximate, morphed to an average brain for display purposes), which demonstrates both a significant effect for orange repetition (novel > repeated) or yellow lexical-frequency (low frequency > high frequency) effects. Arrows from electrodes point to plots of HGP for low-frequency novel words (greenish-yellow), high-frequency novel words (bright yellow), repeated words (orange), and false fonts (gray). The dark gray bar at the bottom notes periods of a significant ANOVA effect between conditions, the orange bar notes periods of significant repetition effects, and the yellow bar notes periods of significant lexical-frequency effects. (B) The left panel shows a brain displaying the proportion of repetition effects, most prevalent in the caudal fusiform. On the right is displayed repetition effect onset times. Orange circles are onset of a repetition effect (novel > repeated) at a specific electrode. The line is the median for each effect in the region.

