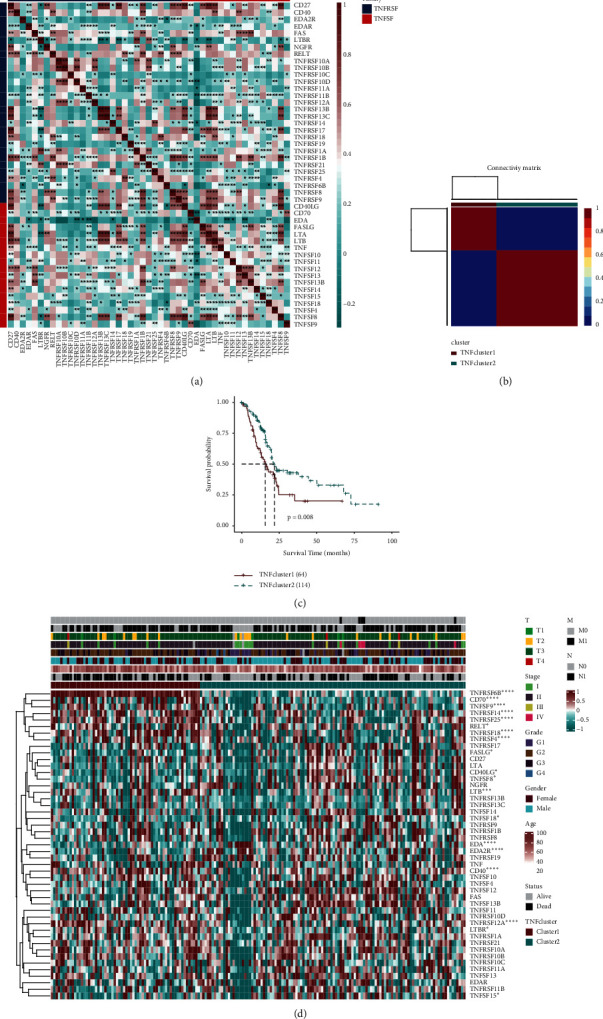
Figure 1.

TNF family genes clustering in PAAD. (a) Correlation analysis of TNF family genes in the TCGA-PAAD dataset. Red is considered positive correlation, and green is considered negative correlation. (b) According to TNF family genes, PAAD was clustered into two groups, TNF-Cluster1 (red) and TNF-Cluster2 (blue). (c) The survival probability analysis of the two TNF clusters. (d) Gene expression maps of the TNF family in two TNF clusters. ∗∗P < 0.01. A prognostic model of PAAD based on TNF family genes was established.
