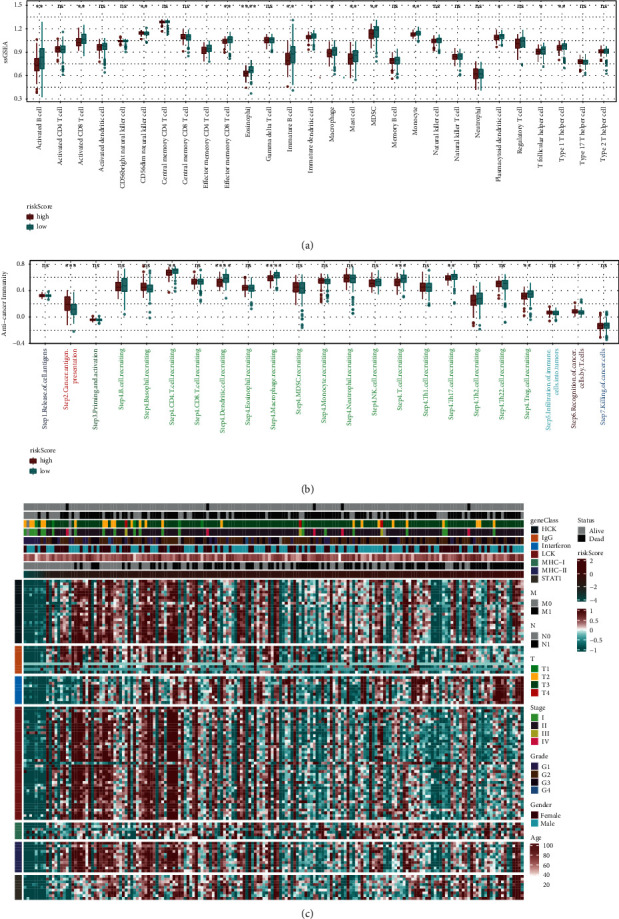
Figure 5.

Immune and inflammatory analysis. (a) Differences in the expression of immune cells between the high-risk score group and low-risk score group. (b) Differences in the expression of immune-cycle activity scores between the high-risk score group and low-risk score group. (c) Changes in gene expression of different inflammatory marker gene sets.
