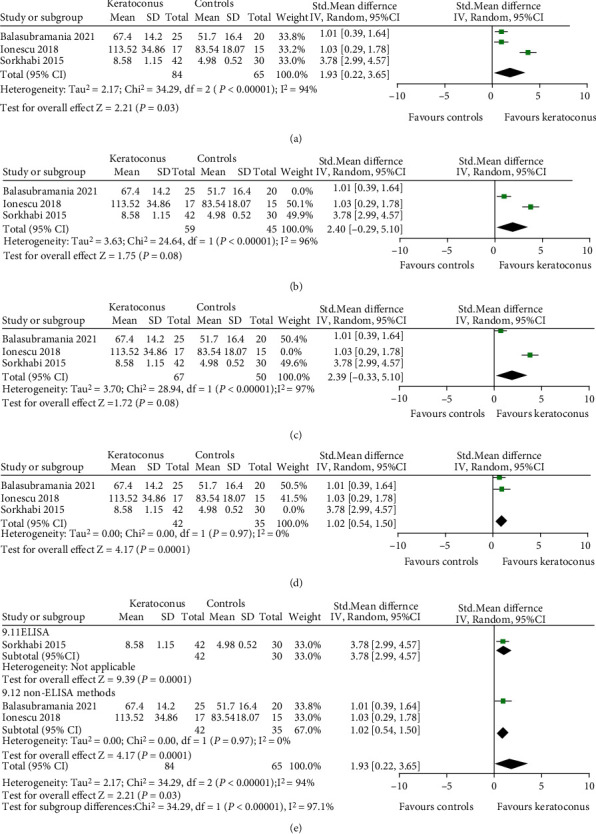
Figure 2.

Forest plot for SMD and 95% CI of IL-1β in tears by keratoconus versus the control group. (a) The pooled effect of IL-1β in all studies. (b–d) Sensitivity analysis of IL-1β in tears by omitting one study in each turn. (e) Subgroup analysis of IL-1β in tears by detection methods.
