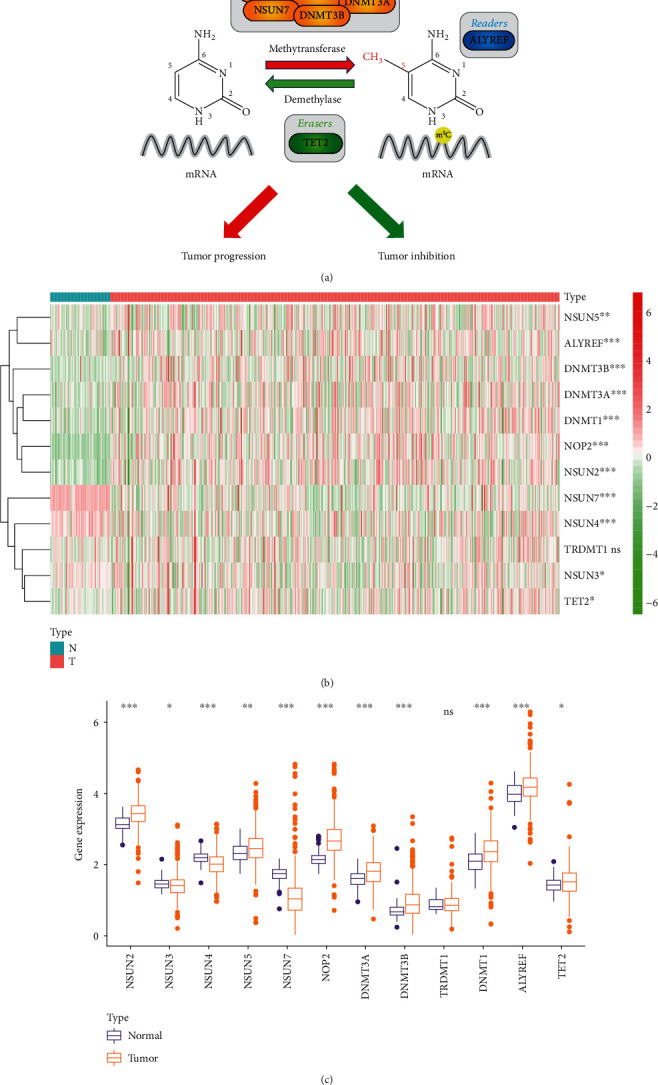
Figure 1.

Different expression of m5C RNA methylation-related genes in ccRCC. (a) Schematic flow chart of N5-methylcytosine (m5C) RNA methylation. (b) The heatmap of twelve m5C RNA methylation regulators in 539 ccRCC and 72 normal tissues from the TCGA database. The color bar from red to green denotes high to low gene expression. (c) The expression of twelve m5C RNA methylation regulators in normal tissues and ccRCC from the TCGA database. ∗p < 0.05, ∗∗p < 0.01, and ∗∗∗p < 0.001. ns: no significance.
