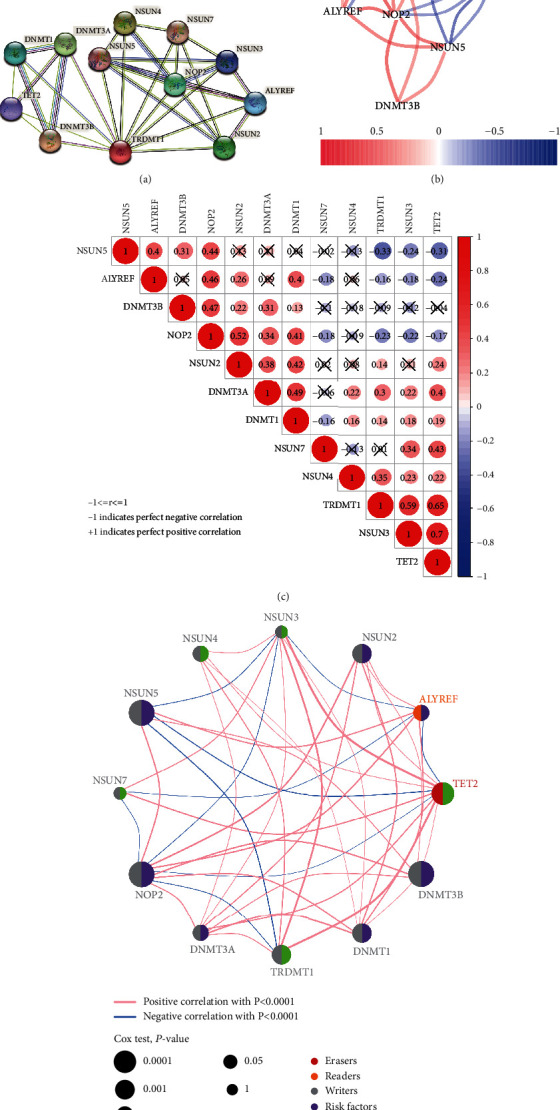
Figure 3.

PPI network and correlation analyses of m5C RNA methylation-related genes. (a) PPI network of the eleven differentially expressed m5C RNA methylation regulatory genes. (b) Correlation analysis at the transcriptional level. (c) Pearson's correlation analysis of these m5C RNA methylation-related genes in the TCGA. Note: ‘r' denotes Pearson's correlation coefficient whose value ranges between -1 (perfect negative correlation) and +1 (perfect positive correlation). (d) A network plot of the function and correlation analysis by Cox test.
