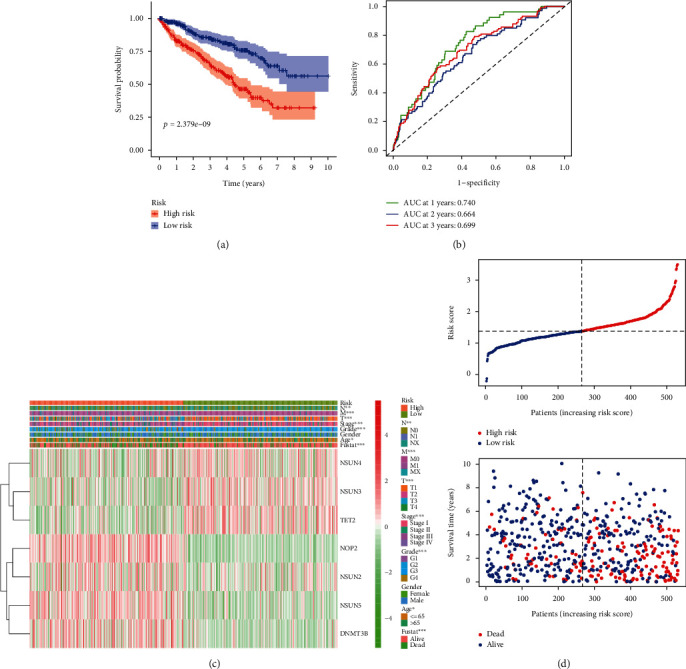
Figure 8.

Validation of the prognostic risk signature in the whole TCGA-KIRC cohort. (a) Kaplan-Meier curve analysis shows the OS of high-risk (n = 258) and low-risk (n = 259) ccRCC patients in the entire TCGA cohort. (b) ROC curve analysis in the entire cohort shows the false positive rate vs. true positive rate plots based on the prognostic risk signature. The AUC values for 1-year (green), 2-year (blue), and 3-year (red) survival rates are also shown. (c) The expression heatmap of the seven prognostic-risk related m5C RNA methylation regulators in the high-risk (blue) and low-risk (pink) ccRCC patients of the entire cohort. ∗∗p < 0.01; ∗∗∗p < 0.001. (d) The distributions of risk scores of the high-risk (red) and low-risk (blue) ccRCC patients and corresponding survival time (the red dots represent the dead patients and the blue dots represent the alive patients) in the entire cohort.
