FIG. 2.
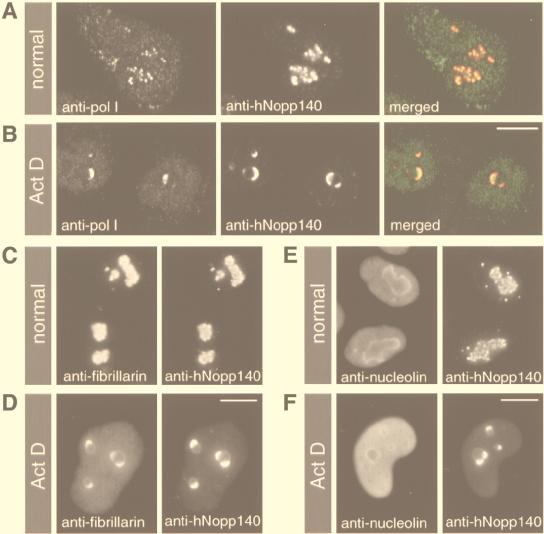
Subcellular distributions of RNA polymerase I, fibrillarin, and nucleolin relative to hNopp140. HeLa cells without (A, C, and E) or with (B, D, and F) actinomycin D (0.08 μg/ml) treatment for 6 h were subjected to double immunofluorescence staining. (A and B) Colocalization of RNA polymerase I and hNopp140 before or after actinomycin D treatment. Cells were costained with anti-RPA194 antiserum (anti-pol I) and CP2 monoclonal antibody (anti-hNopp140). Images from the same confocal plane were analyzed by confocal laser scanning microscopy. In the merged image, RNA polymerase I (green) and hNopp140 (red) are extensively overlapped (yellow). (C and D) Colocalization of fibrillarin and hNopp140 regardless of the actinomycin D treatment. Cells were double stained with the S4 autoimmune serum (anti-fibrillarin) and CP2 monoclonal antibody (anti-hNopp140). (E and F) Distinct distribution patterns of nucleolin and hNopp140 in normal and actinomycin D-treated cells. Nucleolin and hNopp140 were detected by monoclonal antibodies CC98 and CP2, respectively. Preparations in panels C to F were examined by fluorescence microscopy. Images from the same microscopic field are shown side by side. Act D, actinomycin D. Bars, 10 μm.

