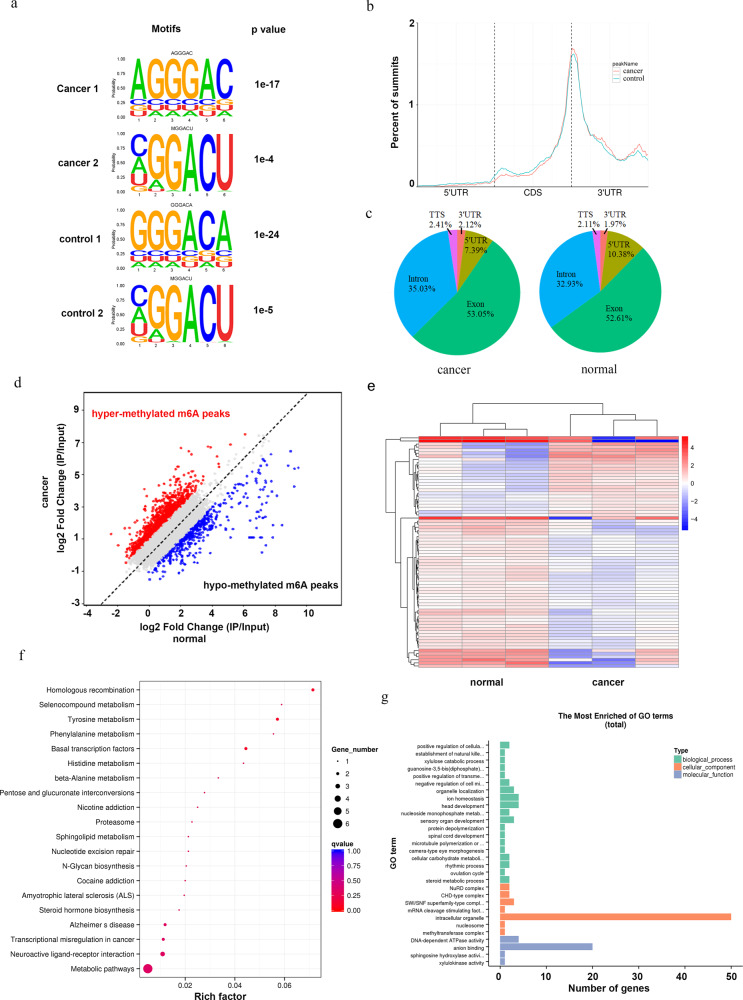
Fig. 2. Variations in m6A-regulated genes in CRC.
a The predominant consensus motif GGAC was detected in both the control and CRC samples by m6A-seq. b Density distribution of m6A peaks across mRNA transcripts. Portions of the 5′ untranslated region (5′ UTR), coding sequence (CDS), and 3′untranslated region (3′ UTR) were split into 100 segments, and then the percentages of m6A peaks that fell within each segment were determined. c m6A peak distribution in the 5′ UTR, start codon, CDS, stop codon or 3′ UTR across the entire set of mRNA transcripts. d Scatter plot for hypermethylated m6A peaks and hypomethylated m6A peaks in CRC tissues compared with control tissues. ‘Hypermethylated m6A peaks’, m6A peaks which are higher in CRC tissues compared to control tissues. ‘Hypomethylated m6A peaks’, m6A peaks which are lower in CRC tissues compared to control tissues. e Heatmap of 75 genes, which shows 1.5-fold m6A-mediated expression alteration in CRC tissues compared with control tissues. f, g The cluster Profiler packages identified the enriched GO and KEGG processes of 75 genes, which showed a 1.5-fold m6A-mediated expression alteration in CRC compared with the control.

