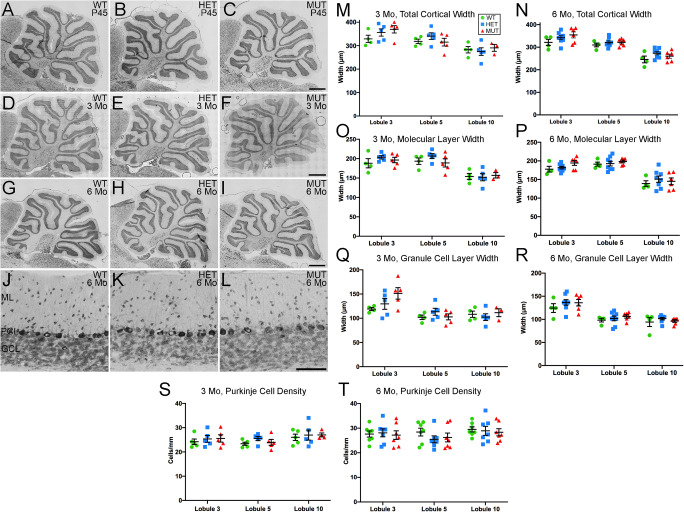
Fig. 3.
Gross cerebellar structure and morphometric analysis. (A–I) Gross cerebellar structure in WT, HET, and MUT rats at postnatal day 45 (P45), 3 months, and 6 months of age is comparable. Scale bar = 1 mm for each row. (J–L) Lamination and cellular distribution in the cerebellar cortex is normal in WT, HET, and MUT rats. Six months of age shown, scale bar = 100 μm. (M–T) Morphometric analysis of cortical layer thickness in WT, HET, and MUT rats indicates no substantial reduction in any cortical layer at 3 months or 6 months, although a significant difference in Purkinje cell layer width between WT and MUT rats was noted in lobule 3 at 6 months (3 months: n = 3–5 animals/genotype. 6 months: n = 4–8 animals/genotype. Data are shown as mean ± SEM. 1-way ANOVA with Tukey’s post-hoc test. *p< 0.05). (U, V) Linear density of Purkinje cells shows no difference among WT, HET, and MUT rats (3 months: n = 5 animals/genotype. 6 months: n = 7 animals/genotype. Data are shown as mean ± SEM. 1-way ANOVA with Tukey’s post-hoc test)

