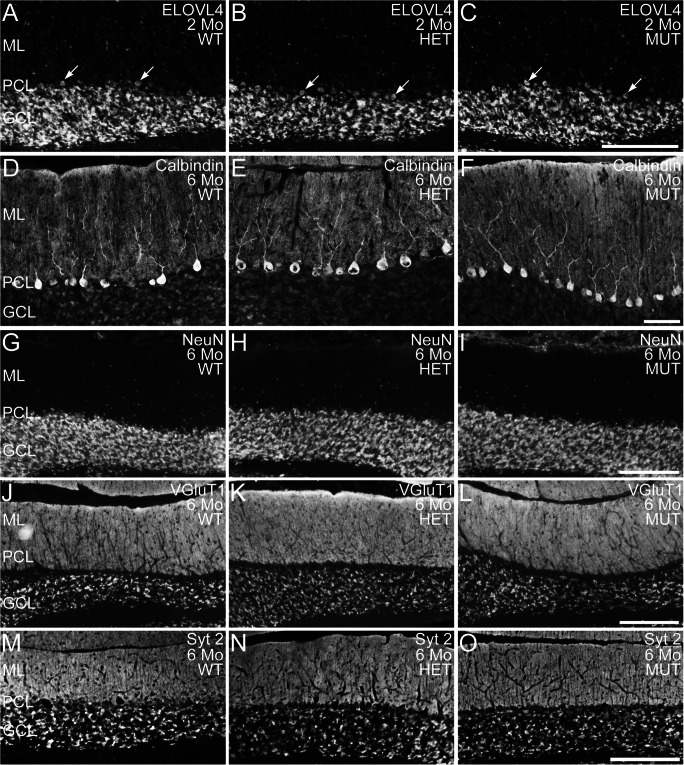
Fig. 4.
Distribution of ELOVL4 and cell- and synapse-specific markers is normal in WT, HET, and MUT rat cerebellum. (A–C) Distribution of ELOVL4 in the cerebellar cortex of WT, HET, and MUT rats is comparable. Labeling is present in granule cells in the granule cell layer (GCL), Purkinje cells (arrows) in the Purkinje cell layer (PCL), and inhibitory neurons in the molecular layer (ML). (D–F) Purkinje cells identified by labeling for calbindin are organized in a monolayer in the Purkinje cell layer (PCL) and show similar structure in the WT, HET, and MUT cerebellum. (G–I) Distribution of NeuN, a marker for granule cells in the granule cell layer (GCL), is comparable across all genotypes. A small population of NeuN-positive cells is also present in the molecular layer (ML), as appropriate. (J–L) Distribution of Vesicular Glutamate Transporter 1 (VGluT1), a marker for excitatory parallel fiber and mossy fiber synapses, is comparable across all genotypes. (M–O) Distribution of synaptotagmin 2 (Syt2), a marker for inhibitory synapses, is comparable across all genotypes. Scale bars = 200 μm for each row

