
Figure 5.
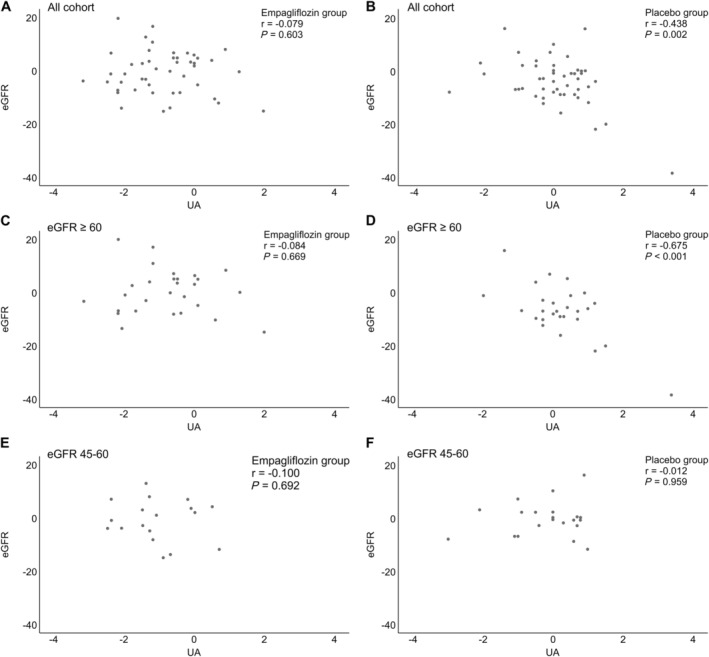
Correlation of the change from baseline to 24 weeks in the estimated glomerular filtration rate (eGFR) vs. that of serum uric acid levels in the empagliflozin (A, C, E) and placebo (B, D, F) subgroups. The placebo group showed a negative correlation between eGFR and uric acid levels, whereas no such correlation was observed in the empagliflozin group.