Figure 2.

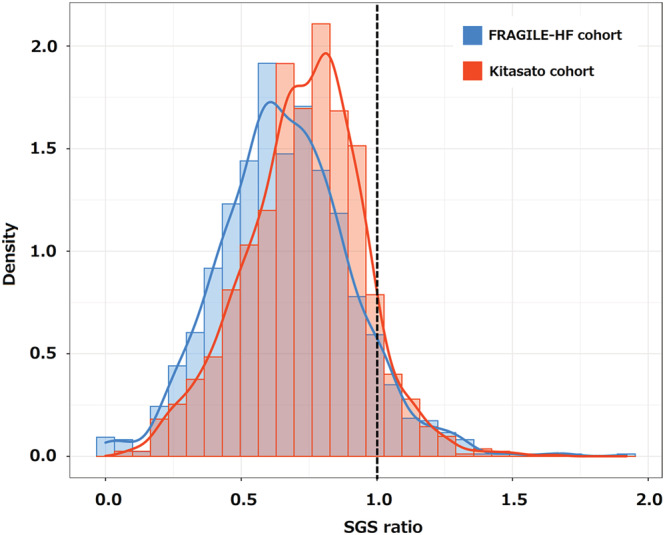
Density plot of the SGS ratio from the FRAGILE‐HF and Kitasato cohorts. The dotted line represents an SGS ratio of 1. SGS, standardized gait speed.

Density plot of the SGS ratio from the FRAGILE‐HF and Kitasato cohorts. The dotted line represents an SGS ratio of 1. SGS, standardized gait speed.